Figures & data
Table 1. Demographics of the MRONJ study population
Figure 1. The α-diversity indices of the bacterial composition and distribution within the oral mucosal microenvironment were not different in patients with MRONJ and healthy controls. The community richness (A, B) and community evenness (C, D)
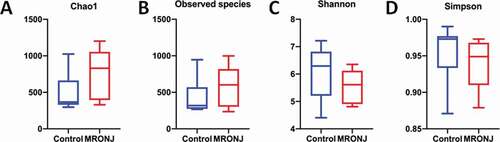
Figure 2. The β diversity of microbiota and the key bacterial alteration within the oral mucosal microenvironment were significantly different in patients with MRONJ and healthy controls. Unweighted and Weighted PCoA results (A, B) and Unifrac ANOSIM analysis (C, D)
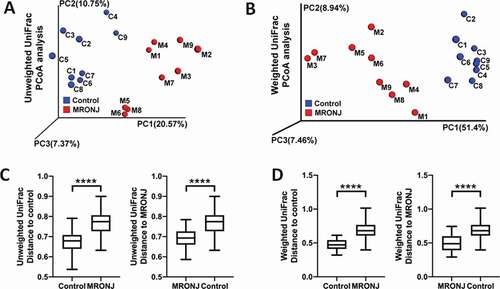
Figure 3. The microbial community composition was characterized by the relative abundance of microbial taxa. (A) The relative abundance of bacterial taxa at the phylum level in each patient. (B) The relative abundance of Bacteroidetes, Spirochaetes, Synergistetes, Tenericutes, Proteobacteria, and Actinobacteria between the MRONJ and healthy groups were detected using real-time PCR. *, P < 0.05;**, P < 0.01;***, P < 0.001
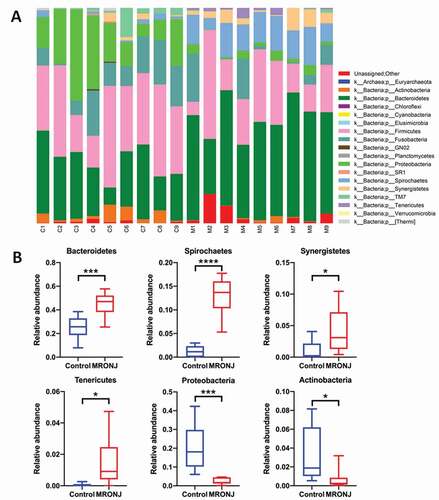
Figure 4. Taxonomic differences of fecal microbiota in PD and healthy groups. (A) Cladogram generated by LEfSe analysis. B, Linear discriminant analysis (LDA) effect size (LEfSe) analysis revealed significant bacterial differences in microbiota between the MRONJ and healthy controls. The LDA scores (log10)>3 and P < 0.05 are listed
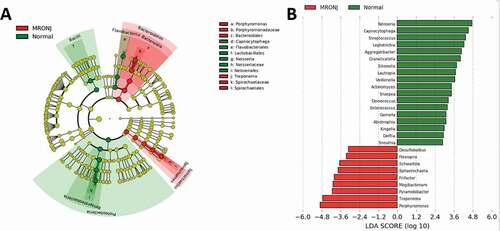
Figure 5. Scatter plot generated from protein microarray data reflecting differential expression proteins (DEPs) between the MRONJ and healthy groups. The basic statistics used for significance analysis are moderated t-statistic. Red presents up-regulation, blue presents down-regulation, and black shows no difference
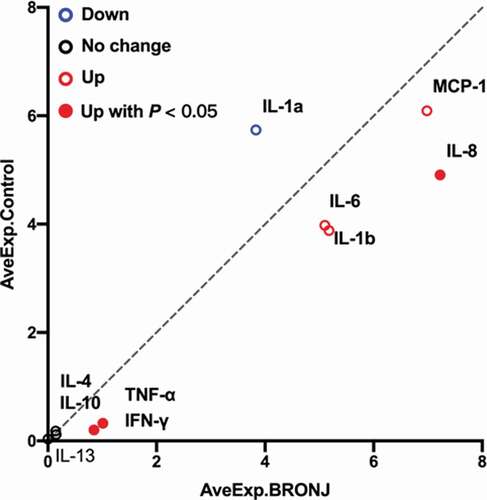
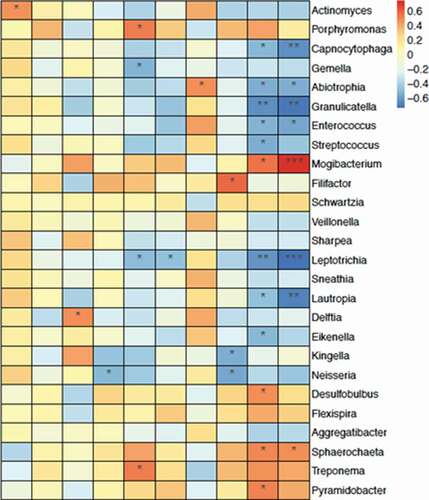
Figure 6. Heat map reflecting the relativity between inflammatory cytokines and differentiated genera at the genus level. Colors reflect the correlation coefficient from positive correlation (red) to negative correlation (blue). *, P < 0.05; **, P < 0.01; ***, P < 0.001