
Figures & data
Figure 1. Flow chart demonstrating selection of study participants. Note: AD: Alzheimer´s disease. MCI: Mild cognitive impairment. SCD: Subjective cognitive decline
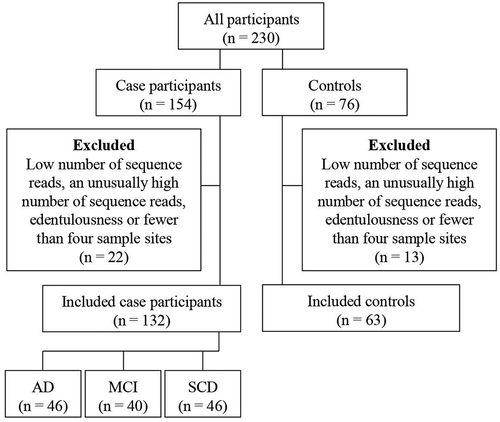
Table 1. Distribution of demographic, socioeconomic and clinical characteristics
Table 2. P-values for differences in microbial alpha and beta diversity measures between variables of interest and potential confounders
Figure 2. Differences in observed richness (number of detected bacterial OTUs) between groups. Note: x: mean. In boxplots, box hinges: 1st and 3rd quartiles, whiskers: box hinge to 1.5 * interquartile range. (a). Controls and diagnostic subgroups; (b). PPD ≥ 6 mm; (c). Sex; (d). Diagnostic subgroups, sex and PPD ≥ 6 mm
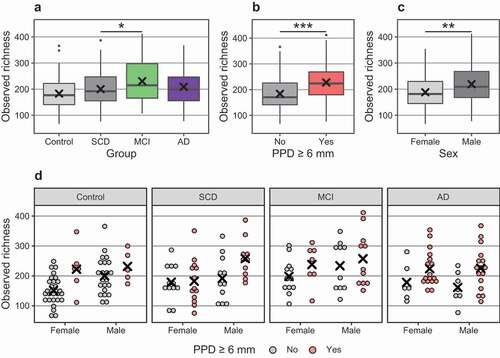
Figure 3. Non-metric multidimensional scaling plots based on Bray-Curtis dissimilarity. Each point corresponds to one participant; the closer the points, the more similar their samples. Ellipses represent 95% confidence intervals. (a). Colors and shapes for diagnostic case subgroups groups, ellipses for study group affiliation (all cases and controls). (b). Plot split by PPD ≥ 6 mm, with colors and shapes for diagnostic case subgroups and ellipses for study group affiliation (all cases and controls)
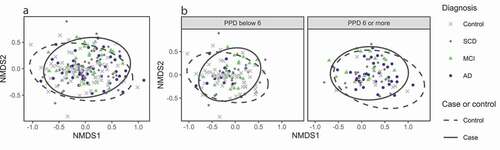
Table 3. Relative abundance (%, mean ± SD) for the ten most common bacterial genera in groups of participants