Figures & data
Table 1. Fold-change increase of the Arg- and Lys-gingipain activity of P. gingivalis whole cells following cysteine and glycylglycine addition to the assay
Figure 1. Colony phenotype of P. gingivalis isolates. Cells were spread on HBA plates and incubated anaerobically before imaging at weekly intervals. (a) week 1, (b) week 2, and (c) week 3
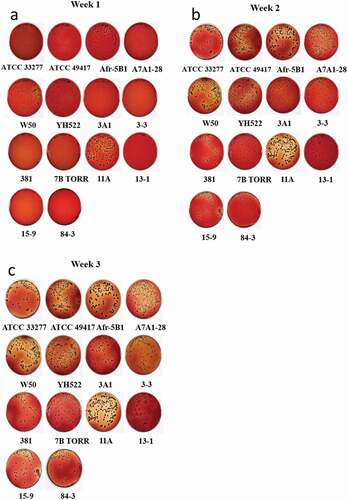
Table 2. Comparison of whole-cell Arg-gingipain Vmax in the presence of 200 mM of cysteine (Cys) or glycylglycine (GlyGly) with 1 mM BApNA substrate
Table 3. The Vmax of P. gingivalis whole-cell and VFSN Arg- and Lys-gingipains
Table 4. The comparison of Arg- and Lys- gingipain Vmax for whole cells (WC) and VFSN
Figure 2. (a) The kinetics curves for P. gingivalis whole-cell Arg-gingipain activities using BApNA as substrate. (b) The kinetics curves for P. gingivalis whole-cell Lys-gingipain activities using GPKNA as substrate
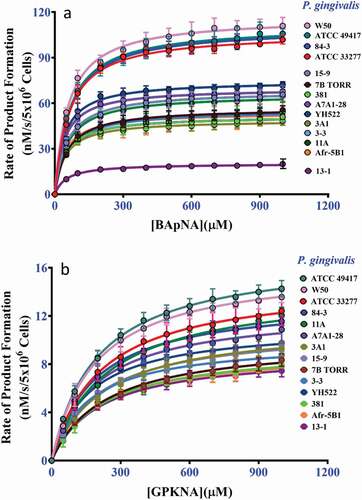
Figure 3. Correlation of the log10 transformed Arg-and Lys-gingipain activities of P. gingivalis (a) whole cells and (b) VFSN. Dashed lines indicate 95% PI with the model
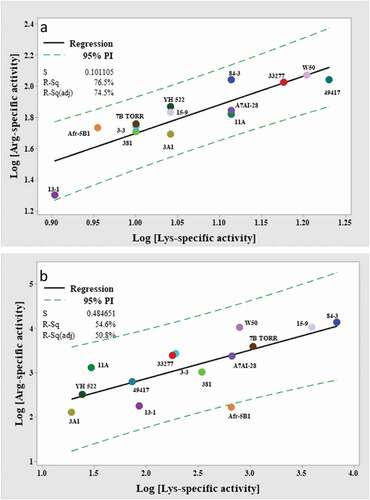
Table 5. The Km for substrates of whole-cell (WC) and VFSN Arg- and Lys-gingipains of P. gingivalis.
Table 6. The calculated Km for BApNA and Vmax of P. gingivalis whole-cell Arg-gingipains with cysteine addition to the assay
Table 7. The Km and Vmax of P. gingivalis whole-cell Arg-gingipains in the presence of 300 mM glycylglycine and 20 mM DTT or 20 mM L-cysteine
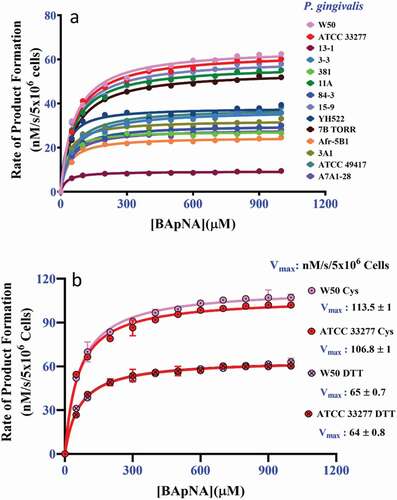
Figure 4. The kinetics of P. gingivalis whole-cell Arg-gingipains using BApNA substrate in the presence of 20 mM DTT and 300 mM glycylglycine. (a) The aggregate kinetic curves for 14 strains using 20 mM DTT as a reducing agent. (b) Control assays using strain W50 and ATCC 33277 cells in the presence of 300 mM glycylglycine and 20 mM DTT or 20 mM cysteine. The data shows DTT is less effective at stimulating the Arg-gingipain activity of these strains than cysteine. (P < 0.05)