Figures & data
Table 1. Comparison of SARS-CoV-2 RNA status in saliva and NOP samples in 201 patients undergoing testing for COVID-19
Table 2. Demographic and clinical characteristics of 201 patients with suspected COVID-19 tested with RT-PCR in both saliva and NOP samples
Figure 1. Comparison of RT-PCR cycle thresholds between naso-oropharyngeal and saliva samples in 37 patients with positive results in both samples. The coefficients of the regression lines are 0.79 (P < 0.001) for gene E and 0.74 (P = 0.002) for gene S.
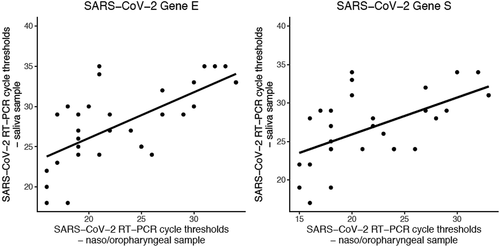
Figure 2. (a/b) – Violin plots showing the distribution of cycle thresholds in nasal-oropharyngeal swabs (NOP) and saliva samples for the two genes (E and S) amplified by RT-PCR. Boxplots shows median, interquartile range and range as standard. Analysis of the 37 patients with positive results in both sample types by comparing the distributions of cycle thresholds between NOP and saliva samples. Paired Wilcoxon’s rank-sum test was used, in which P-values were <0.001 for genes E and S. (c/d) – Distribution of SARS-CoV-2 RT-PCR cycle thresholds in the 52 positive nasal-oropharyngeal swabs (NOP) samples stratified by RT-PCR results in saliva (NOP+/saliva- versus NOP+/saliva+). Boxplots shows median, interquartile range and range as standard. Distributions were compared by using paired Wilcoxon’s rank-sum test, in which P-values were 0.21 and 0.35 for genes E and S, respectively
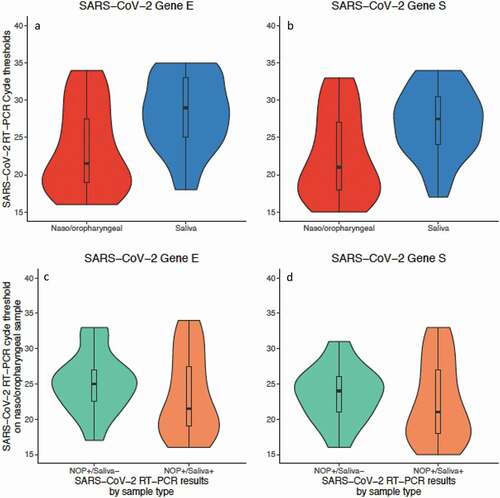
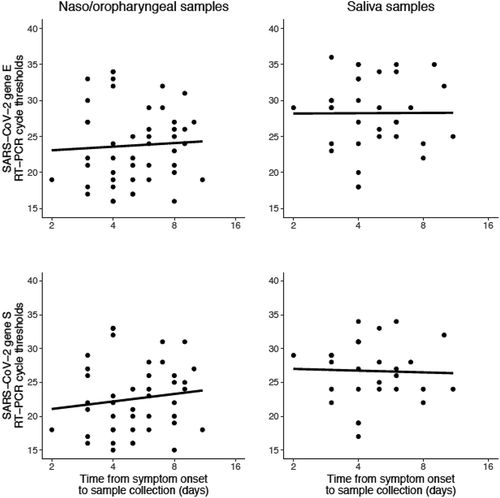
Figure 3. Relationship between illness course (i.e. time elapsed between symptom onset and sample collection) and cycle threshold values for nasal-oropharyngeal swabs (NOP) (left-hand panels) and saliva samples (right-hand panels). In the NOP samples, the regression coefficients for cycle threshold (delay of log2-days) for genes E and S were 0.5 (P = 0.72) and 1.1 (P = 0.42), respectively; the regression coefficients for saliva samples were 0.04 (P = 0.98) and −0.26 (P = 0.87) for genes E and S, respectively