Figures & data
Table 1. Bacterial strains and plasmid used in this study
Table 2. List of oligonucleotide primers used in this study
Figure 1. Construction and confirmation of Streptococcus mutans T4 Rnl1 mutant. a Incubated for 24 hr on a spectinomycin selective plate. Positive colonies were obtained in mutant strains carrying spectinomycin-resistance pDL278 vectors. b Colony PCR products of wild type (WT) and mutant (WT_B for WT carrying pDL278 blank vector, WT_T for WT carrying pDL278_t4rnl1 vector) strains pictured by agarose gel electrophoresis. The WT_T mutant strain showed the specific band around 100 bp (t4rnl1 fragment is 109 bp), while the other two strains did not. c Detection of the ligated transfer RNA chimeras of tRNA-Gly and tRNA-Ser by RT-PCR. The specific band could be seen in the WT_T mutant strain
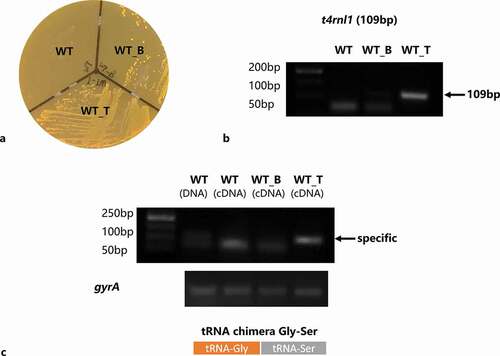
Figure 2. A Growth curves of WT and mutant strains in planktonic cultures. Each experiment was repeated 10 times. b WT and mutant strains were allowed to form stable biofilms for 24 hr in brain heart infusion (BHI) plus 1% sucrose biofilm medium. Their biomass was quantified by crystal violet staining, and the optical density at 575 nm was read. The data represent 10 biological replicates and are presented as the mean ± standard deviation. * Kruskal-Wallis test p< 0.05
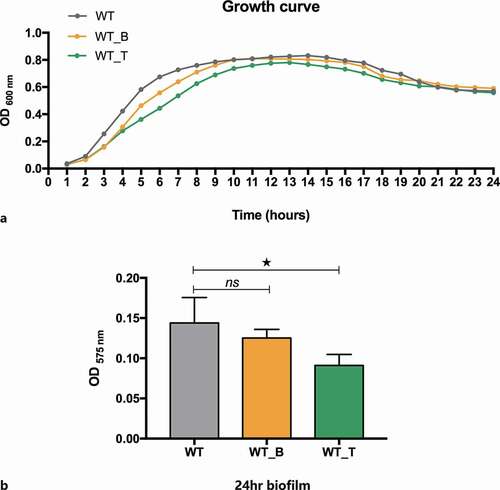
Figure 3. Scanning electron microscopy observations of the architecture of S. mutans WT, WT_B and WT_T strain biofilms. WT_T showed decreased extracellular polymeric substances in the biofilms interspersed among ‘blank’ areas (yellow arrows). Representative images are shown from at least six randomly selected positions of each sample
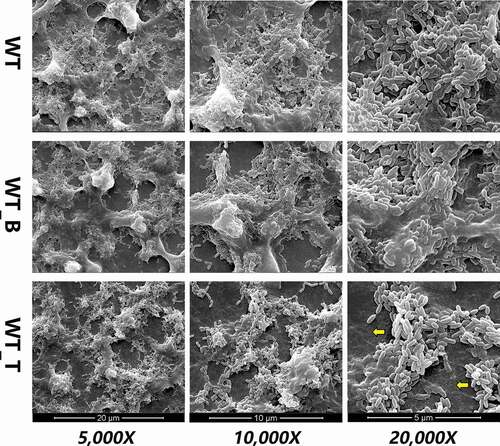
Figure 4. Typical confocal laser scanning microscopy images of 24-hr biofilms of S. mutans WT, WT_B and WT_T strain biofilms. All images are three-dimensional projections of bacteria (green) and the glucan matrix (red)
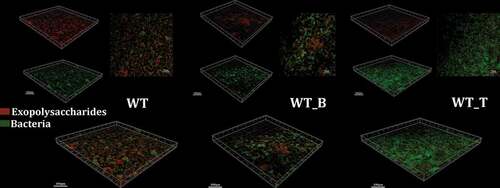
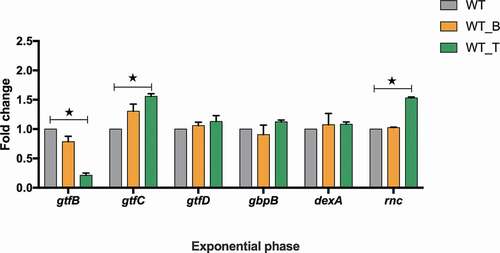
Figure 5. gtfB/C/D, gbpB, dexA and rnc expression of S. mutans WT, WT_B and WT_T strains in the mid-exponential phase measured by qRT-PCR. The results are presented as the mean ± standard deviation. * Kruskal-Wallis test p< 0.05