Figures & data
Table 1. Analysis of colonies grown onto YPD + antibiotics plates. The table summarises the number (n) and frequency (%) of samples which formed colonies for a) yeasts, – with b) indicating the mean and the range of the number of colonies for the yeast positive samples – c) molds, d) bacteria, and e-q) identified fungal species as determined by MALDI-TOF per group: subjects with DS (Down Syndrome) and matched control individuals
Table 2. Significance of differentially abundant taxa and other variables between DS and matched controls. Columns indicate, in this order, the taxonomic level or the type of variable considered, the organism name or the variable name, the tendency of the difference in DS (↗: higher in DS, ↘: lower in DS, permanova results are not directional), the mean adjusted p-value of the statistical comparison between DS and matched controls, and the numbers of matched controls sub-samples for which the test is significant (out of the 100 matched control groups that were sampled from the total SLL2 dataset). Rows are ordered by mean adjusted p-value within each variable group
Figure 1. Down Syndrome differs in factors affecting oral health. (a) Mean relative abundances of 15 of the most abundant genera in DS samples and matched controls. The remaining genera are grouped together and colored in white. (b) The two most significantly differentially abundant genera are shown (Kingella and Alloprevotella), as well as the salivary pH and alpha diversity as calculated by the Shannon diversity index
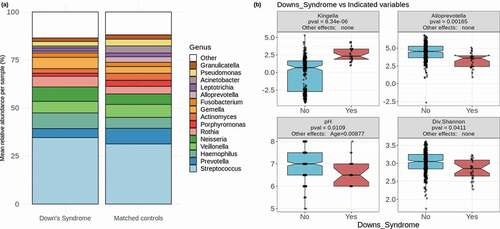
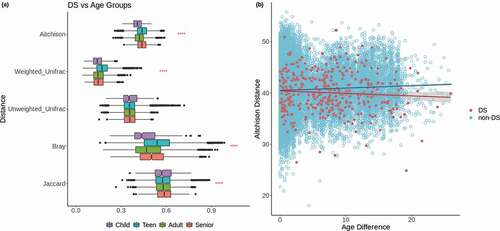
Figure 2. Comparisons across age. (a) Distributions of distances between DS samples and non-DS samples of each age group based on five distance metrics. Red stars represent p-values for Kruskal-Wallis tests to compare the means of each age group within the comparison of a given distance metric. The representation of p-values are as follows: 0 ‘****’ 0.0001 ‘***’ 0.001 ‘**’ 0.01 ‘*’ 0.05 ‘ ’ Not significant. (b) Scatterplot of age differences between pairs of samples vs Aitchison distance between those samples. Red points represent DS samples compared to other DS samples, blue points represent non-DS samples compared to other non-DS samples, with corresponding lines of the best fit