Figures & data
Figure 1. Infection of macrophages by E. faecalis and their intracellular localization within the cytoplasm. A. TEM images of E. faecalis infection prior to macrophage differentiation showing i. bacteria within the cytoplasm of a macrophage (yellow arrows), ii–iv. Sections with bacterial replication (binary fission; red arrows) within intracellular vacuoles. Bi-ii. immunofluorescent images with the uptake of CFSE-stained E. faecalis by fully differentiated macrophages
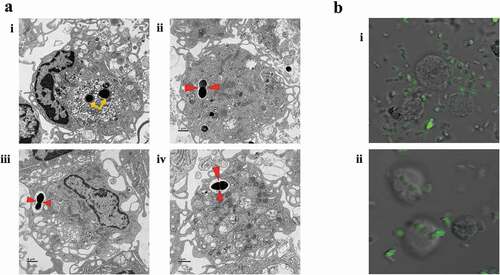
Figure 2. Infection of macrophages by E. faecalis had no adverse effect on cellular differentiation. A. Flow cytometry scattergrams showing the percentage expression of CD11b on the Y-axis and F4/80 on the X-axis. Cell populations in the top right corner are CD11b+F4/80+ . B. Bar chart of the CD11b+F4/80+ cell population in the control (M0; M1; M2) and experimental groups (pre-M0 + E. faecalis; pre-M0 + E. faecalis + LPS and INF-γ; pre-M0 + E. faecalis + IL-4 and IL-13; post-M0 + E. faecalis). Pre-M0: cells prior to differentiation into macrophages; post-M0: differentiated macrophages. Groups linked with a horizontal bar are not significantly different (P > 0.05; N = 3)
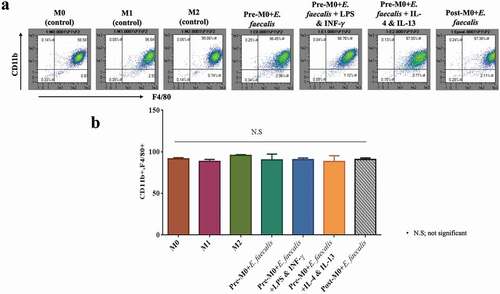
Figure 3. Enterococcus faecalis infection prior to macrophage differentiation inhibited cell apoptosis. A. Flow cytometry scattergrams showing the percentage expression of Annexin V (Y-axis) in the control and experimental groups. Cell populations in the top right corner are macrophages expressing the apoptosis marker B. Bar chart showing the mean percentage of F4/80-positive (X-axis) cell population that expresses Annexin V (N = 3)
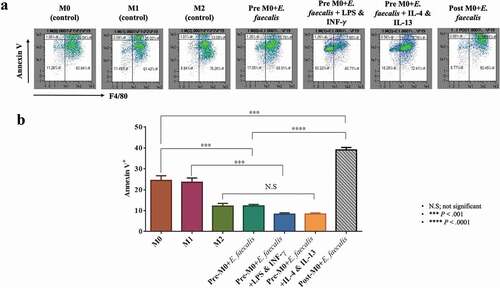
Figure 4. Enterococcus faecalis infection shifted macrophage polarization to M1-like phenotype. A. Flow cytometry scattergrams showing the percentage % expressions of CD38. B. Bar chart showing the mean percentage of F4/80-positive cell populations that expresses CD38 (N = 3)
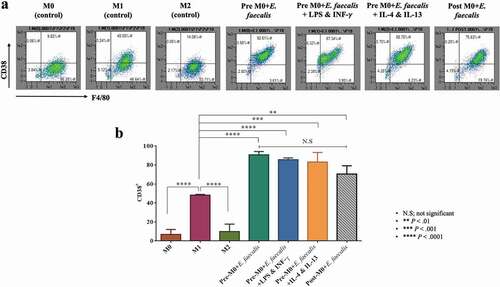
Figure 5. Macrophage polarization to the M1-like phenotype after infection with E. faecalis was evident by the lower expression of EGR2; marker for M2 macrophages. A. Flow cytometry scattergrams showing the percentage % expressions of EGR2. B. Bar chart showing the mean percentage of F4/80-positive cell populations in the control and experimental groups that are EGR2 positive (N = 3)
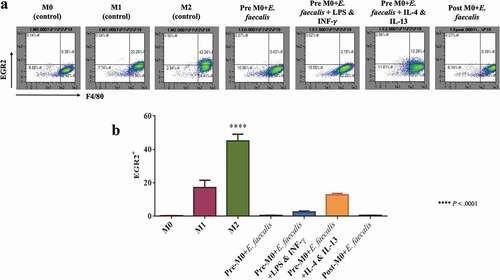
Figure 6. Expression of IRF5 protein in infected and control M1 macrophages. A. Western blot of IRF5, which is normally expressed in M1 macrophages, were expressed in pre-M0 + E. faecalis and post-M0 + E. faecalis, β-actin was used as the housekeeping protein. B. Bar chart showing the mean band intensity of IRF5 protein expression among the different tested groups (N = 3)
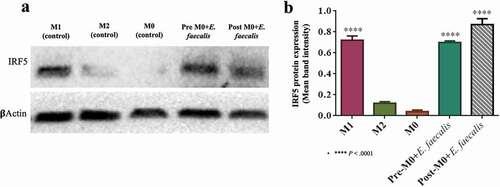
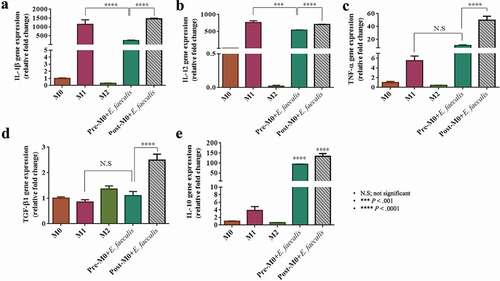
Figure 7. Enterococcus faecalis infection of differentiating macrophages induced an abnormal inflammatory cytokine profile in differentiated macrophages. Levels of mRNA expression of A. IL-1β, B. IL-12, C. TNF-α, D. TGF-β1 and E. IL-10. Data were normalized to β-actin (relative fold changes)