Figures & data
Figure 1. Study model and workflow for caries lesion initiation, progression, and arrest in vivo. Appliances used for biofilm accumulation: (A) modified orthodontic band for smooth surfaces, and (B) mesh for occlusal surfaces. (C) Study workflow
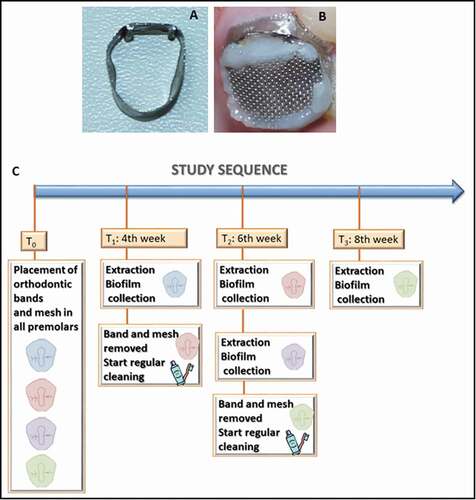
Figure 2. Micro-CT analysis confirms caries lesion progression and arrest of the studied specimens in the in vivo model. (A, E, I) Micro-CT cross-sectional slices of teeth after 4 weeks of biofilm accumulation (1) or after 2 weeks of tooth cleaning procedures (2) in smooth (buccal) surfaces. (C, G, K) Micro-CT cross-sectional slices of teeth after 4 weeks of biofilm accumulation (1) or after 2 weeks of tooth cleaning procedures (2) in occlusal surfaces. (B, D, F, H, J, L) Density profile plots along dotted red lines in active and arrested caries specimens. Red areas indicate ΔZ (integrated mineral loss area)
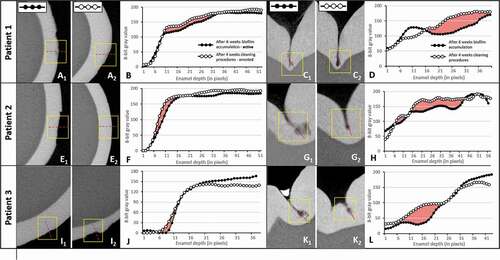
Figure 3. Most abundant bacterial genera (A) and species (B): profiles according to patient, timeline, and dental surfaces
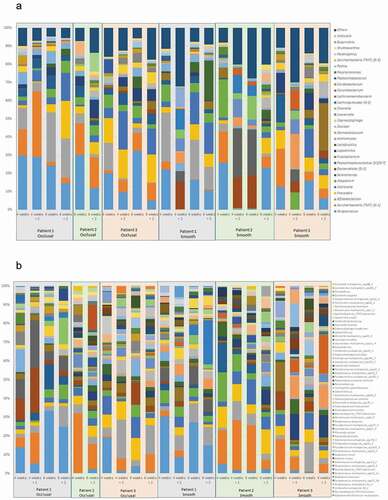
Figure 4. Genus differences in the bacterial microbiome composition in relation to dental surfaces and timeline. (A) Total distribution of bacterial taxa at genus level on smooth and occlusal surfaces. For illustrative purposes, only genera with abundances ≥ 1% on smooth or occlusal surfaces are represented. The total representation per sample is 92%. (B) Different time points show variations in relation to bacterial microbiome genus abundances (expressed by median OTUs). For illustrative purposes, only the 10 more abundant genera are represented
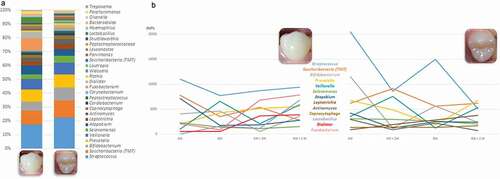
Figure 5. Bacterial composition in biofilms from active and arrested caries lesions at the genus level derived from 16S rRNA gene Illumina sequencing. Median values. Red arrows indicate lesion development (active white spot lesion, upper graphs) and blue arrows indicate lesion arrest (inactive white spot lesion, lower graphs)
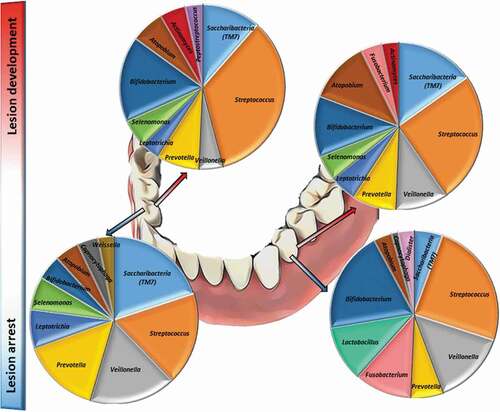
Table 1. Top 10 ranked most abundant bacterial species in biofilms from lesion development (active white spot lesion) and arrest (inactive white spot lesion)
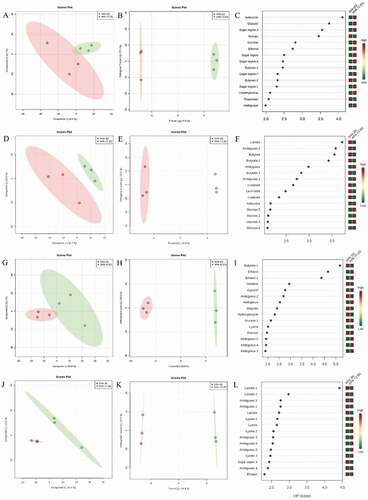
Figure 6. Differences in bacterial metabolomic profiles between groups. (A) PLSDA; (B) O-PLS-DA; (C) VIP score of 4-weeks mature biofilm and 2-weeks newly formed biofilm in occlusal surface. (D) PLSDA; (E) O-PLS-DA; (F) VIP score of 4-weeks mature biofilm and 2-weeks newly formed biofilm in buccal surface. (G) PLSDA; (H) O-PLS-DA; (I) VIP score of 6-weeks mature biofilm and 2-weeks newly formed biofilm in occlusal surface. (J) PLSDA; (K) O-PLS-DA; (L) VIP score of 6-weeks mature biofilm and 2-weeks newly formed