
Figures & data
Table 1. Epidemiologic characterization of patients
Figure 1. Saliva NMR data analysis. (a) OPLS/DA score plot of the spectra of saliva samples obtained from the healthy (H) and periodontitis (PT) groups. The saliva sample score plots of the H group were dispersed, while those of the PT group were clustered. (b) OPLS/DA score plot of PT patients. The patients were clustered into two subgroups (PT_G1 and PT_G2) (c) Variable Importance in Projection (VIP) scores of the important discriminatory metabolites obtained from the OPLS-DA models. (d) Metabolites identified to discriminate the H, PT_G1, and PT_G2 groups. * p < 0.05
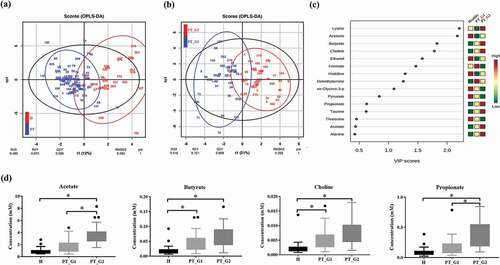
Figure 2. Bacterial community comparison. (a) Alpha diversity of the buccal and supragingival plaque samples calculated using the Shannon index. (b) Beta diversity of the buccal and supragingival plaque samples evaluated using principal coordinates analysis based on the abundance of species. (c) Relative abundance of bacterial phylum composition of buccal and supragingival plaques. (d) Relative abundance of bacterial genus composition of buccal and supragingival plaques
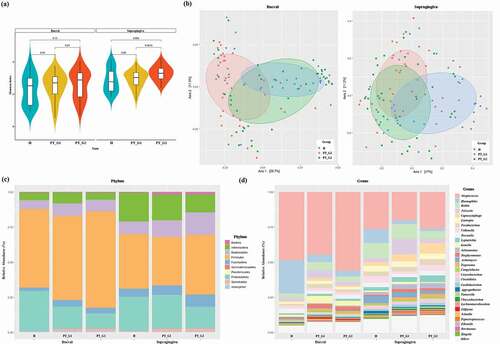
Figure 3. Comparison of significant taxa. LEfSe analysis was performed for all bacterial species, and the most discriminant ones (LDA score > 3.5) in decreasing order for each dataset are reported. (a) Buccal H vs. PT_G1, (b) Buccal H vs. PT_G2, (c) Buccal PT_G1 vs. PT_G2 (d) Supragingiva H vs. PT_G1, (e) Supragingiva H vs. PT_G2, and (f) Supragingiva PT_G1 vs. PT_G2
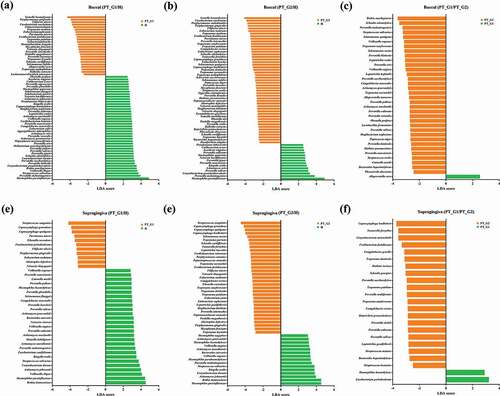
Figure 4. Integrated correlation-based network analysis of buccal microbiome and metabolites. Spares partial least squared correlation analysis was performed using mixOmics to determine the correlations between oral microbiome and identified metabolites. Yellow boxes denote bacterial species whose abundance was significantly increased in PT patients. Green boxes denote bacterial species whose abundance was significantly decreased in PT patients. Orange boxes denote metabolites whose concentrations were significantly increased in PT patients. Sky-blue boxes denote metabolites whose concentrations were significantly decreased in PT patients. (a) Network of the H group and PT_G1 subgroup. (b) Network of the H group and PT_G2 subgroup
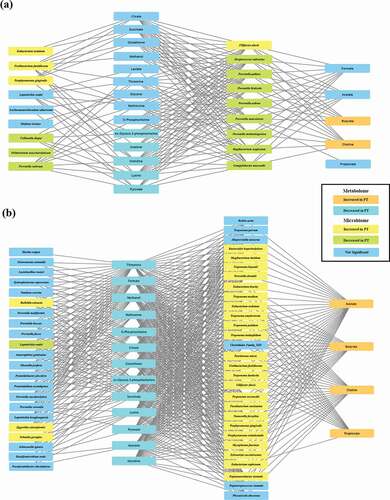
Table 2. Clinical parameters of baseline and follow-up evaluation in PT_G1 and PT_G2