Figures & data
Figure 1. Antimicrobial activities of II-6s against S. mutans. (a) Chemical structure of the small molecule compound II-6s. (b) Time-kill curve of II-6s or CHX against S. mutans at MBC. (c) Dose-dependent killing curve of II-6s or CHX against S. mutans within 5 min. Results are expressed as log10 (CFU/ml) and data are presented as means ± SD. (d) Scanning electron micrographs of S. mutans morphology after treatment with II-6s or CHX at MIC for 12 h. Negative control was untreated S. mutans. Yellow arrows indicate that the smooth surface of S. mutans cells became uneven and plicated
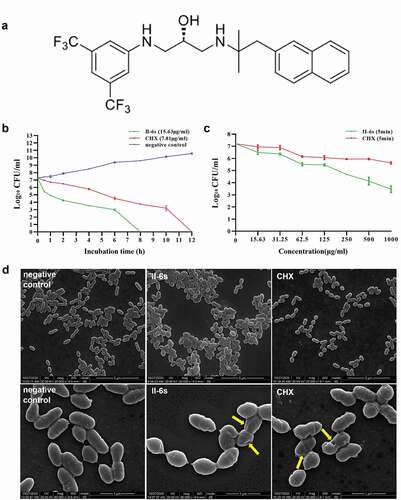
Table 1. Antimicrobial effect of II-6s on planktonic cultures and biofilms of S. mutans, S. gordonii, and S. sanguinis in BHI medium
Figure 2. Effect of II-6s on the microbial composition of mixed biofilms. (a) Representative images of bacteria/EPS staining, dead/live bacteria staining and fluorescent in situ hybridization (FISH) of 3-species biofilms. (b) The volume of EPS and bacteria within the biofilms. (c) The EPS/bacteria ratio within the biofilms. (d) Quantitative analysis of the dead/live bacteria ratio within the biofilms. (e) Quantitative analysis of the bacterial species composition based on quantitative PCR. Data are presented as means ± SD. *P < 0.05, **P < 0.01, ***P < 0.001, ****P < 0.0001 as compared to the PBS treated control. ##P < 0.01, as compared to the CHX-treated group. N.S., not significant
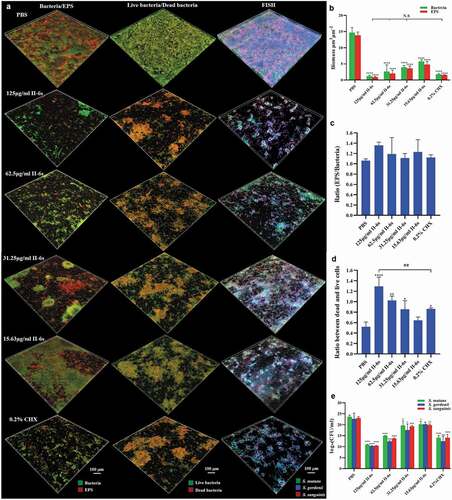
Figure 3. The anti-demineralization effect of II-6s against three-species biofilms. (a) Representative transverse microradiography images of bovine enamel slabs exposed to three-species biofilm-induced experimental demineralization. The high-density regions represent the sound enamel tissues, while the low-density shadows indicate the caries-like lesions. (b) Lesion depth and (c) mineral loss of enamel slabs were calculated. Data are presented as means ± SD. *P < 0.05, **P < 0.01, ***P < 0.001, ****P < 0.0001 as compared to the PBS treated control. N.S., not significant
Figure 4. Cytotoxicity of II-6s on human oral cells. The cytotoxicity of II-6s on human gingival epithelial cells (HGE), human oral keratinocytes (HOK), and macrophages RAW264.7 after treatment at indicated concentrations for 5 min (a, b, c) and 24 h (d, e, f), respectively. Data are represented as means ± SD
Figure 5. MICs of II-6s and CHX against planktonic S. mutans after repeated exposure from passages 0 to 15. Data are presented as mean values of MICs from three independent repeats