Figures & data
Figure 1. Formation of multispecies biofilm and the experimental schemes of this study
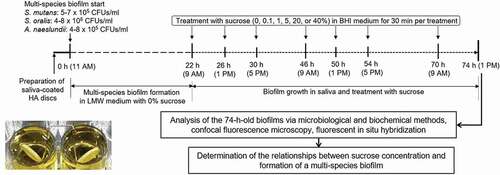
Figure 2. Changes in bacteria counts of the multi-species biofilm. (A) Bacterial counts. (B) Proportion of bacteria. Values in the same group (S. mutans group, S. oralis group, A. naeslundii group, respectively) followed by the same superscripts are not significantly different from each other (P > 0.05)
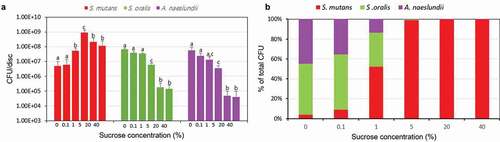
Figure 3. Changes in fluorescence in situ hybridization (FISH) study. (A) Representative confocal images (S. mutans, stained red; S. oralis, stained green; A. naeslundii, stained purple). (B) Bio-volume. (C) Mean thickness. *P < 0.05, significantly different from 0% sucrose
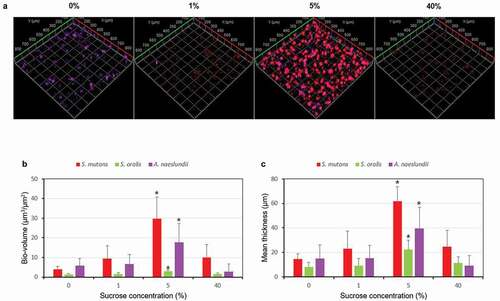
Figure 4. Changes in bacteria viability of the multispecies biofilm. (A) Representative confocal images (live cells, stained red; dead cells, stained green). (B) Bio-volume. (C) Mean thickness. Values followed by the same superscripts are not significantly different from each other (P > 0.05)
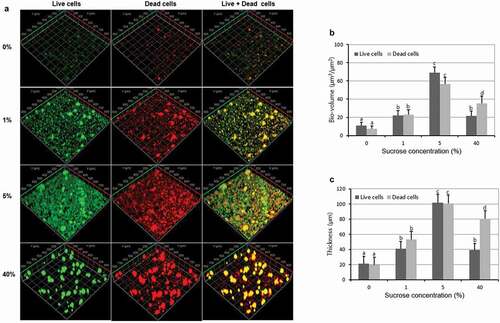
Figure 5. Comparison of the live and total bacteria cells in the multispecies biofilm. (A) Total bacteria counts (based on the data in Figure 2). (B) Bio-volume of live cells. (C) Bio-volume of total cells in FISH study (based on the data in Figure 3B). (D) Bio-volume of total cells in live/dead study (based on the data in Figure 4B). Values followed by the same superscripts are not significantly different from each other (P > 0.05)
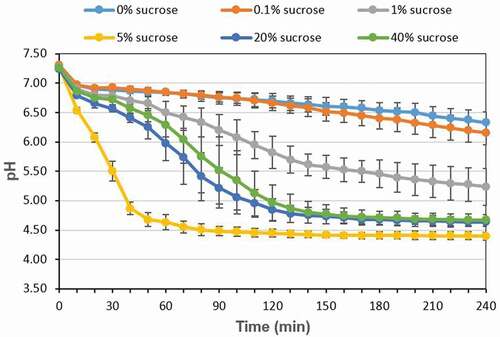
Figure 6. Changes in acid production of the multispecies biofilm