Figures & data
Table 1. Characteristics of participants under investigation for COVID-19 diagnosis by paired NPSs and saliva samples
Table 2. Comparison of the RT-qPCR detection of SARS-CoV-2 between NPSs and saliva samples
Figure 1. Comparison of Ct values from NPSs and saliva samples. (A) All positive NPSs (n = 35) and saliva samples (n = 52) were compared using a Mann–Whitney test (p = 0.097). Bars represent the median and 95% CI. (B) Paired positive samples (n = 29), represented by the connecting lines, were compared by a Wilcoxon test (p = 0.761)
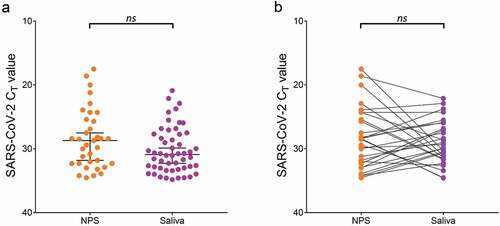
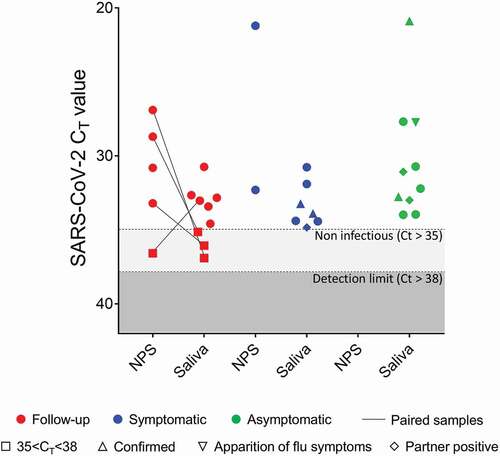
Table 3. Comparison of the RT-qPCR detection of SARS-CoV-2 between NPSs and saliva samples according to participant status
Table 4. Comparison of the RT-qPCR detection of SARS-CoV-2 between NPSs and saliva samples to a reference that considers a person to be positive if one of his or her samples is positive