Figures & data
Table 1. E. gingivalis colonisation according to treatment and time
Figure 1. Overall alpha diversity as measured by Shannon’s Diversity Index in E. gingivalis-negative (coral red) and E. gingivalis-positive (turquoise) individuals (P = 0.03), including post-treatment samples
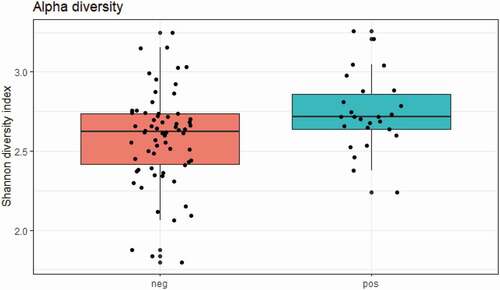
Figure 2. Overall alpha diversity as measured by Shannon’s Diversity Index in E. gingivalis-negative (coral red) and E. gingivalis-positive (turquoise) individuals (P = 0.03), excluding post-treatment samples (see text for details)
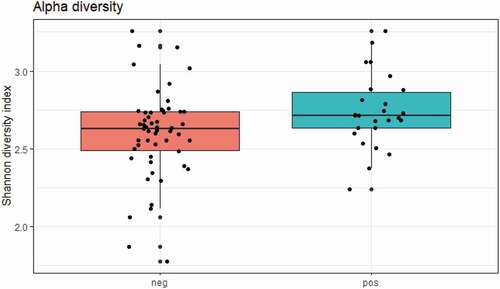
Figure 3. Beta diversity of E. gingivalis-negative (red dots) and E. gingivalis-positive (blue dots) individuals (P = 0.88) as measured by Bray–Curtis dissimilarity analysis
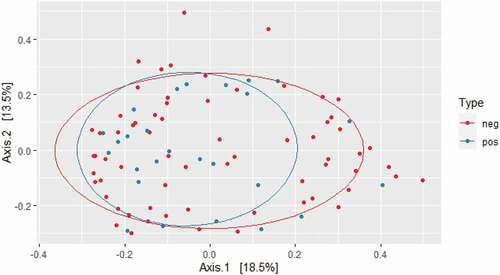
Table 2. The top-ten most common genera identified in E. gingivalis-negative and E. gingivalis-positive individuals, respectively, as detected by heat map analysis. Genera that differ are indicated in boldface type
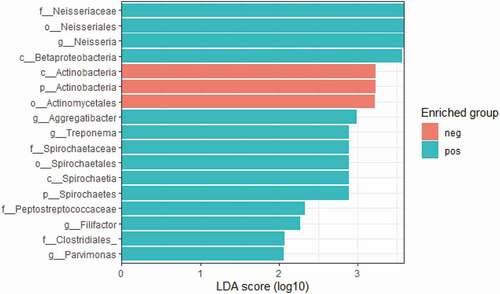
Figure 4. LEfSe plot displaying the bacterial taxa enriched in the E. gingivalis-positive (turquoise) and E. gingivalis-negative (coral red) groups, respectively