Figures & data
Table 1. Demographic data and clinical features of the study groups
Figure 1. Major taxa identified in the study groups. Sequencing of the V1-V3 region of the 16S rRNA (2 x 300 bp) was performed on DNA extracted from tongue scraping samples. The raw sequences were merged, quality-controlled and assigned species-level taxonomies. The stacked bars show the average relative abundances of all phyla, top 11 genera and top 13 species (top taxa are those with average abundance of ≥ 2% in the control group). HOT: human oral taxon
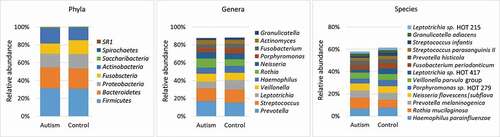
Figure 2. Species richness and diversity. Standard QIIME scripts microbiological profiles were subsampled and used to calculate observed richness, expected richness (Chao index), and alpha diversity indices (Shannon’s and Simpson’s). Left: Box and whisker plots of species richness and alpha diversity in each group. Differences were not significant by Mann–Whitney U test. Plots were generated with R Package. Right: clustering of samples with PCA using STAMP
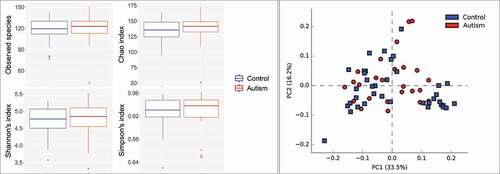
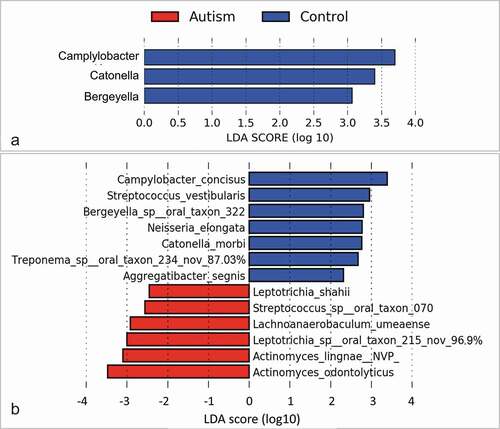
Figure 3. Differentially abundant taxa. (a) Genera and (b) species identified by linear discriminant analysis (LDA) effect size analysis (LEfSe) to differ in relative abundance between the two study groups as. None of them achieved a false discovery rate (FDR) ≤ 0.2. Nov: potentially novel species with the percentage indicating similarity to the closest hit