
Figures & data
Table 1. Amino acid sequences and physicochemical properties of peptides studied
Figure 1. Helical wheel diagrams of LF-1 (A), LF-2 (B), and lactoferrampin (C). Arrows indicate the direction of the hydrophobic moment. Blue represents hydrophilic amino acid residues, whereas yellow represents hydrophobic amino acid residues. The hydrophobic faces of LF-1 and LF-2 are LLAALLWW and LLLAAILLGWW, respectively. No apparent amphiphilic interface exists in the sequence of lactoferrampin
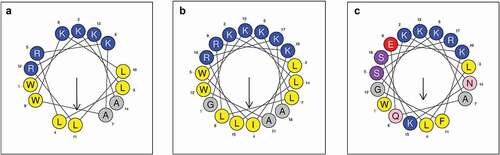
Figure 2. Circular dichroism and tryptophan fluorescence spectra of LF-1 (A, D), LF-2 (B, E), and lactoferrampin (C, F) in free solutions (PBS or HEPES) and membrane-mimetic solvents (SDS or LUVs). In the tryptophan fluorescence spectra, arrows indicate a blue shift of peak fluorescence towards a shorter wavelength
Table 2. Minimum inhibitory concentration and minimum bactericidal concentration of peptides on tested bacteria
Figure 3. TEM observations of bacterial membrane and intracellular structure of S. mutans, A. viscosus, and L. acidophilus after treatment with 64 μM LF-1 and LF-2
Figure 4. The inhibitory effect of LF-1 and LF-2 on the formation of S. mutans biofilm (A, B), as well as the eradication of 1-d preformed S. mutans biofilm by LF-1 and LF-2 (C, D) are illustrated by the absorbance at 595 nm and CFU number, respectively. Columns labelled with different superscript letters denote significant statistical differences among treatments (One-way ANOVA, p < 0.05). For the biofilm inhibition assay (A, B), representative images of stained biofilms treated with peptides at concentrations ranging from 64 to 0 μM are presented above the columns
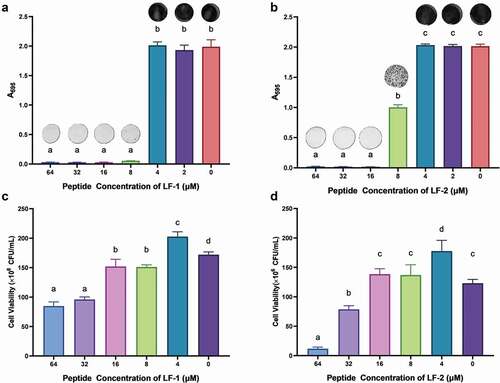
Figure 5. (A) Representative CLSM images of live, dead, and merged bacterial cells in preformed S. mutans biofilms treated with peptides for 24 h. Live cells are stained green with SYTO 9, whereas dead cells are stained red with propidium iodide (PI). (B) Biomass percentages of live and dead cells, calculated according to five randomly selected images. Data are presented as the mean ± SD (*p < 0.05)
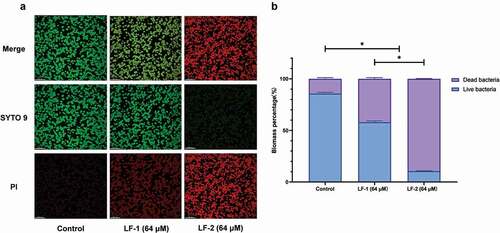
Table 3. Evaluation of Keyes caries scoring method on smooth and sulcal surfaces of rat molars compared across experimental groups