Figures & data
Figure 1. pH developments in 24-h S. mutans biofilms under static conditions. A) Average pH in 24-h biofilms exposed to whole saliva and sucrose never dropped below 6.5. Each line represents the average pH recorded in the top and bottom layer of five fields of view from one biofilm. Error bars = SD. B) Biofilm pH was clearly dependent on the saliva concentration in the medium. Each line represents the average pH of four biofilms, with pH being recorded in the top and bottom layer of five fields of view in each biofilm. Error bars = SD. C) The difference in pH could not be attributed to a bactericidal effect of saliva. Viability was high in biofilms kept in whole saliva (67.9% ± 10.2% SD) and in 0.9% NaCl (70.7% ± 12.3% SD), as evidenced by viability staining. Representative images are shown for biofilms kept in saliva (C1) and in 0.9% NaCl (C2). Viable cells appear green, membrane compromised cells red. Bars = 20 µm. D) Average pH in the biofilms is positively correlated with the buffer capacity of the surrounding medium. The coding of grey shades is the same as in B. Error bars = SD
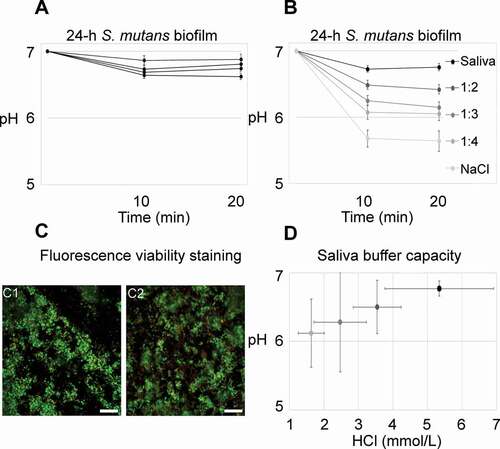
Figure 2. pH developments in 48-h, 72-h and 168-h S. mutans biofilms under static conditions. A) pH drops in 48-h, 72-h and 168-h biofilms exposed to saliva and sucrose were more pronounced than in 24-h biofilms, but a considerable degree of variation could be observed between individual biofilms. Each line represents the average of pH recordings in the top and bottom layer of five fields of view (FOVs) in a biofilm. Error bars = SD. B) pH in the biofilms was not correlated to biofilm age. Each dot represents the average pH in one biofilm. C) No correlation was observed between average biofilm pH and bacterial viability, as determined by BacLight staining in five FOVs in each biofilm. D) Local biofilm pH varied considerably between different FOVs inside a single biofilm. Each line represents the pH recorded in one FOV in a representative 72-h biofilm. Error bars = SD. E) pH in a specific FOV of a biofilm was correlated to local biofilm thickness for 48-h and 72-h biofilms, but not for 168-h biofilms. Each symbol represents the local pH and biofilm thickness in one FOV. F) A tendency was observed between local pH in an FOV and the relative bacterial area coverage at the bottom of the biofilm, but the correlation failed to reach the level of statistical significance
Figure 3. pH developments in 48-h, 72-h and 168-h S. mutans biofilms under dynamic conditions. pH was recorded ratiometrically for a total of 135 min after exposure to sucrose in 48-h biofilms (A), 72-h biofilms (B) and 168-h biofilms (C). Initially, measurements were performed under static conditions for 30 min (S1). Thereafter, a flow rate of 0.8 mm/min was applied for 30 min (F1), followed by a second static phase (30 min, S2). Then, a flow rate of 8 mm/min was applied for 30 min (F2), followed by 15 min with a flow rate of 80 mm/min (F3). Each line represents the average of the pH recordings in the top and bottom layer of five fields of view in a biofilm. Grey and black lines show pH developments in flow cells providing a low (≤ 50 µm) or high (> 50 µm) flow space, respectively. Of all parameters investigated, the flow space had the most pronounced effect on biofilm pH. Error bars = SD
Figure 4. The influence of the flow-space on biofilm pH. A strong correlation was observed between the average pH measured in a biofilm and the flow space. A high flow space and thus saliva film thickness resulted in low pH drops in the biofilms. Grey and black symbols represents the average pH in biofilms exposed to low (≤ 50 µm) and high (> 50 µm) flow-space, respectively
Figure 5. Visual representation of pH developments over time. Panels A-F show the pH in one field of view (FOV) of a 72-h biofilm exposed to a low flow space (5 µm), as recorded by pH ratiometry. Panels G-L show the pH in an FOV of another 72-h biofilm, exposed to a high flow space (83 µm). A and G show an overlay of the fluorescence recorded in the green and red channels from the C-SNARF-4 stained biofilms. In the biofilm with a low flow space, the green fluorescence dominates, indicating a low pH, whereas the red fluorescence dominates in the biofilm with a high flow space. In panels B-F and H-L, bacteria were removed from the images and the pH in the biofilm matrix was visualized using a lookup table (16 colours). After 30 min of exposure to sucrose under static conditions (S1-30), pH dropped to 5.3 ± 0.2 SD in the first FOV (B). With the onset of 0.8 mm/min of flow (F1-30), pH dropped to 5.1 ± 0.3 SD (C). pH remained unchanged during the second static phase (S2-30: 5.1 ± 0.3 SD, D) and increased moderately after exposure to higher flow rates of 8 mm/min (F2-30: 5.3 ± 0.2 SD, E) and 80 mm/min (F3-15: 5.3 ± 0.2, F). In the second FOV, only minor pH drops were observed in the first static phase and after the onset of 0.8 mm/min of flow (S1-30: 6.7 ± 0.05 SD, H; F1-30: 6.6 ± 0.05 SD, I). After a moderate pH drop during the second static phase (S2-30: 6.4 ± 0.1 SD, J), pH in the FOV was neutralized by the onset of 8 mm/min and 80 mm/min of flow (F2-30: 7.03 ± 0.03 SD, K; F3-15: 7.1 ± 0.03 SD, L). Bars = 20 µm
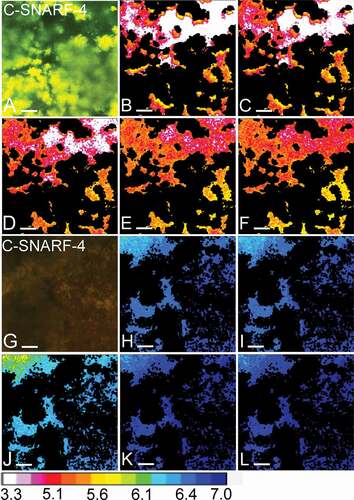
Figure 6. Local pH gradients in 48-h, 72-h and 168-h S. mutans biofilms under dynamic conditions. A) At flow rates of 0.8 mm/min, 8 mm/min and 80 mm/min, pH in different fields of view of a biofilm was not correlated with the local biofilm thickness. B) Under static conditions (S), vertical pH gradients in the biofilms were small, with a tendency towards lower pH in the top layer of the biofilms (negative ΔpH, (S) symbols). With the onset of 8 mm/min of flow (F) pH in the top layer of the biofilms increased compared to pH in the bottom layer (ΔpH of (F) more positive compared to (S)). Each symbol represents the average vertical pH gradient of five FOVs in a biofilm. Error bars = SD. C) Horizontal pH gradients between FOVs that were situated upstream or downstream in the flow cells did not follow a systematic pattern. D) No correlation could be observed between area coverage at the bottom of a FOV and local pH. E) pH recordings from different FOVs of a representative 72-h biofilm illustrate the horizontal pH gradients in the biofilms. pH was recorded under static conditions (S1, S2) and under dynamic conditions with 0.8 mm/min (F1), 8 mm/min (F2) or 80 mm/min of flow (F3). Each line represents one FOV. Error bars = SD