Figures & data
Table 1. Characteristics of the children participating in the study
Figure 1. Salivary concentration of molecules associated with the immune system. Box plots show: A. Levels of IgA in children without caries (CF) and with caries. B. Levels of IgA in children without caries (CF), children with ICDAS 1 and 2 (CA1), and children with ICDAS greater than 3 (CA2). C. Levels of cathelicidin LL-37 in children without caries (CF) and with caries. D. Levels of cathelicidin LL-37 in children without caries (CF), children with ICDAS 1 and 2 (CA1), and children with ICDAS greater than 3 (CA2)
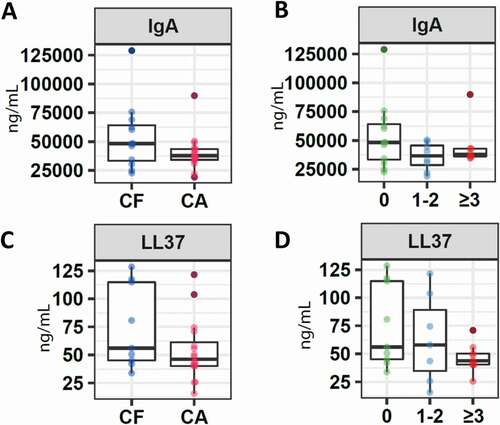
Figure 2. Salivary concentration of molecules associated with the adhesion capacity of microorganisms. Boxplots correspond to: A. Levels of statherin in children without caries (CF) and with caries. B. Levels of statherin in children without caries (CF), children with ICDAS 1 and 2 (CA1), and children with ICDAS greater than 3 (CA2). C. Levels of fibronectin in children without caries (CF) and with caries. D. Levels of fibronectin in children without caries (CF), children with ICDAS 1 and 2 (CA1), and children with ICDAS greater than 3 (CA2). The asterisk (*) indicates significance of p < 0.05 as per the Kruskal–Wallis analysis
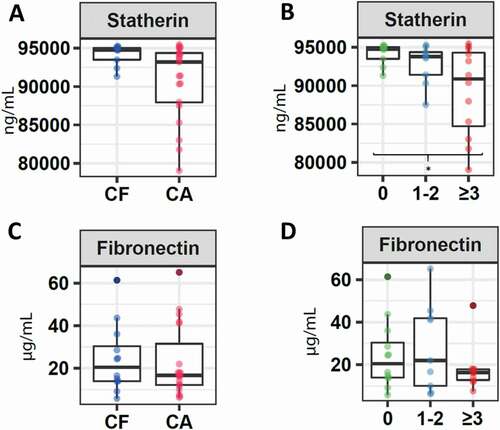
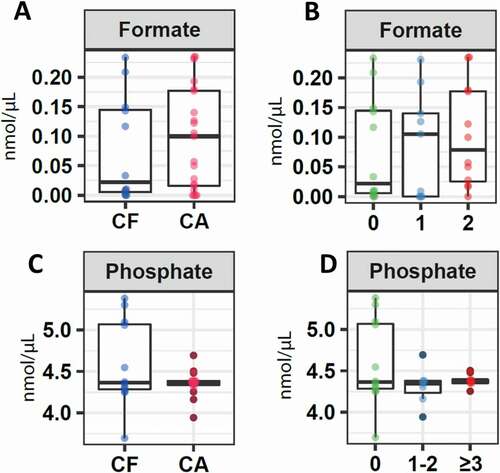
Figure 3. Salivary concentration of molecules associated with the pH. Boxplots represent: A. Differential levels of formate in children without cavities (CF) and with cavities. B. Formate levels in children without caries (CF), children with ICDAS 1 and 2 (CA1), and children with ICDAS greater than 3 (CA2). C. Phosphate levels in children without cavities (CF) and with cavities (C). D. Phosphate levels in children without caries (CF), children with ICDAS 1 and 2 (CA1), and children with ICDAS greater than 3 (CA2)