
Figures & data
Table 1. Demographic and baseline characteristics of glaucoma subjects
Table 2. Gini index for accuracy condition in genus levels using random forest machine learning
Figure 1. Metagenome analysis using machine learning and statistical models
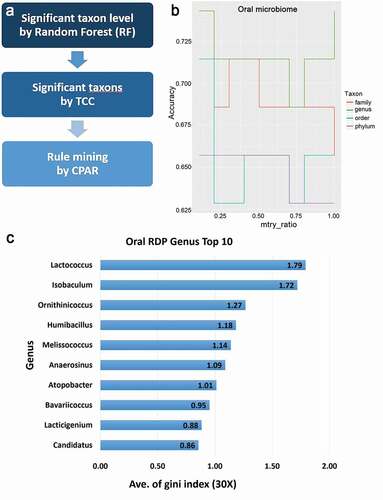
Figure 2. Comparison of alpha-diversity in glaucoma patients as compared with the control subjects
Figure 3. Differences in the oral microbiome of glaucoma patients compared with control subjects using principal component analysis for beta-diversity
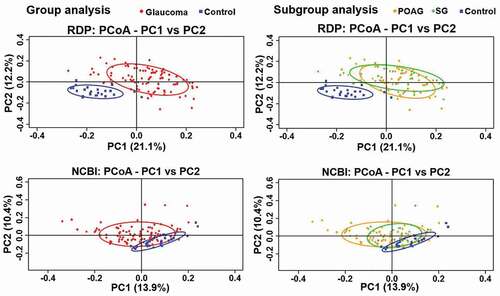
Figure 4. Beta-Diversity differences in the microbiome of glaucoma patients and control subjects

Figure 5. MA and volcano plots generated using analysis with tag count comparison for oral microbiome of glaucoma patients and control subjects
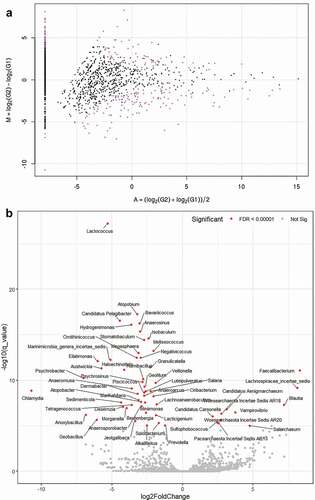
Figure 6. MA and volcano plots generated using subgroup analysis with tag count comparison for oral microbiome in the POAG subgroups compared with the control group
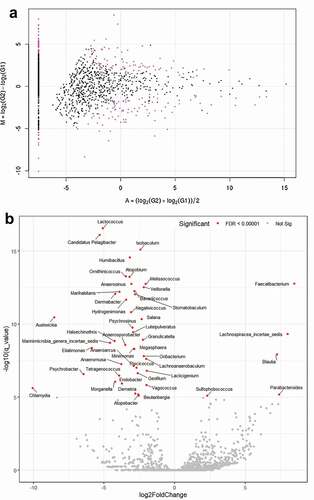
Table 3. Multinomial logistic regression analysis of factors related taxon in glaucoma group compared with control subjects
Table 4. Association rules generated by association rule mining for glaucoma using oral microbiome data
Table 5. Multinomial logistic regression analysis of factors related taxon in primary open-angle glaucoma
Table 6. Association rules generated by association rule mining for primary open-angle glaucoma