Figures & data
Figure 1. 1D SDS-PAGE of LDP solution (right well), visualized with Coomassie Brilliant Blue stain. Protein bands visible with the Coomassie stain were identified by LC-MS/MS and are listed below. Left well, High-range Rainbow molecular weight marker (bio-rad). 1. Transmembrane secretory component. 2. Serum albumin pre-proprotein, Ig alpha-1 chain C region and alpha-amylase 1 precursor. 3. Alpha-amylase 1 precursor, unnamed protein product with molecular weight 54,127 Da, hypothetical protein with molecular weight 53,228 Da, immunoglobulin alpha heavy chain variable region (partial) and immunoglobulin G heavy chain variable region (partial). 4. Alpha-amylase 1 precursor, Ig alpha-1 chain C region, immunoglobulin alpha-2 heavy chain and bactericidal/permeability-increasing protein 1. 5. Carbonic anhydrase 6 isoform 1 precursor, unnamed protein product with molecular weight 38,775 Da, zinc-alpha-2-glycoprotein precursor, alpha-1-antitrypsin precursor, kallikrein-1 preproprotein, alpha-amylase 1 precursor and protein LEG1 homolog precursor. 6. IgG kappa chain (partial), immunoglobulin light chain (partial), unnamed protein product with molecular weight 18,867 Da, immunoglobulin variable region (partial), immunoglobulin lambda light chain VLJ region (partial), cystatin-SN precursor, unnamed protein product with molecular weight 66,151 Da and parotid secretory protein. 7. Prolactin-inducible protein precursor, unnamed protein product with molecular weight 18,867 Da, cystatin-SN precursor and putative lipocalin 1-like protein 1. 8. Prolactin-inducible protein precursor, cystatin-SN precursor, cystatin-S precursor, cystatin D, cystatin-C precursor, cystatin-SA precursor, thioredoxin isoform 1, cystatin-B and cystatin-A
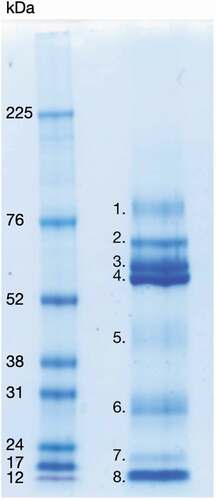
Table 1. Cellular functions associated with uniquely expressed proteins in planktonic and biofilm cells
Figure 2. Comparison of proteomes in planktonic and biofilm cells (grown on uncoated and MUC5B- or LDP-coated surface). Urcl: Urease cluster protein, LeuC: 3-isopropylmalate dehydratase (large subunit), SGO_1479: Uncharacterized protein, PurD: Phosphoribosylamine–glycine ligase, PurN: Phosphoribosylglycinamide formyltransferase, PurK: N5-carboxyaminoimidazole ribonucleotide synthase, AbpB: Membrane dipeptidase (amylase binding protein), MsmF: Multiple sugar metabolism transmembrane permease, SGO_0965: Uncharacterized protein
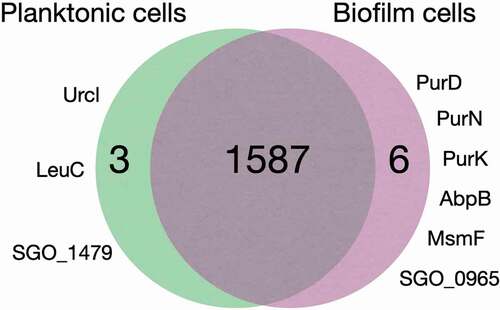
Figure 3. Clustering analysis. Hierarchical cluster of z-scored LFQ intensities for proteins with significant difference in abundance (ANOVA, p < 0.05; Benjamini–Hochberg FDR) between the different growth conditions
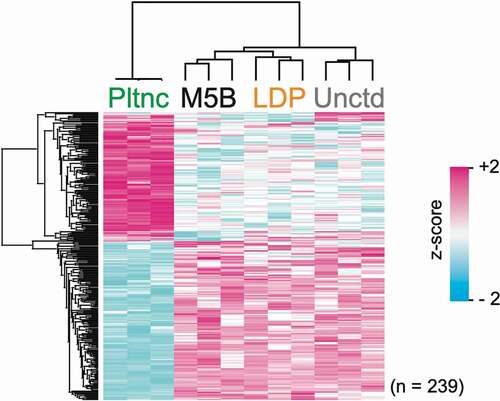
Table 2. Protein abundances in MUC5B biofilms compared to LDP biofilms (p < 0.05, FC > 2)
Figure 4. Volcano plot representation of proteins in S. gordonii DL1 biofilm cells grown on salivary MUC5B-coated surface versus LDP-coated surface from LC-MS/MS data. The lines indicate arbitrary cut-off values for enrichment (fold change > 2) and significance (p < 0.05). Proteins with significant difference in abundance are indicated in the figure and listed in
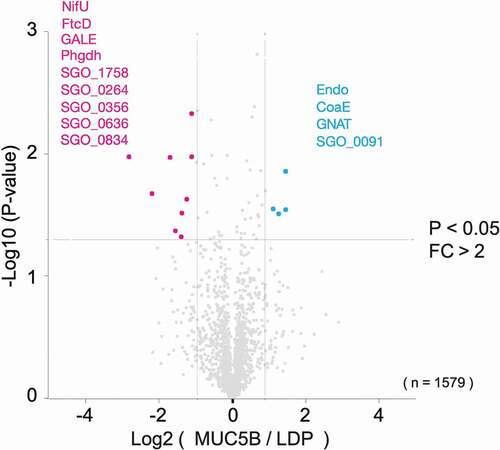
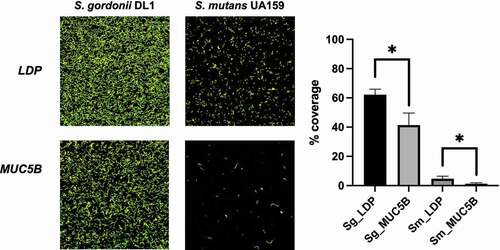
Figure 5. S. gordonii DL1 and S. mutans UA159 biofilms on LDP- and MUC5B-coated Ibidi VI flow cell IbiTreat surfaces after 2 h of flow. Differences in % coverage were calculated between all four groups using one-way ANOVA, * = p < 0.05. The experiment was performed in triplicate using independent bacterial cultures