Figures & data
Figure 1. The effects of C. concisus strains on PD-L1 mRNA expression in HT-29 cells and FLO-1 cells after 4 hours. HT-29 cells (A) or FLO-1 cells (B) with and without IFN-γ sensitization were incubated with C. concisus strains (P2CDO4, P15UCO-S2, BEO1 or BEO2) at MOI 10 or 100 for 4 hours. PD-L1 mRNA expressions were measured by qRT-PCR. IFN-γ sensitized HT29 cells were used as the positive control and untreated cells were used as the negative control. The straight-line bar indicates significance test compared with IFN-γ sensitized cells. One-way analysis of variance (ANOVA) with Dunnett’s test was performed. Graphs are representative of averages of triplicate experiments ± standard error (* = P < 0.05; ** = P < 0.01; **** = P < 0.0001 indicates statistical significance). MOI: multiplicity of infection
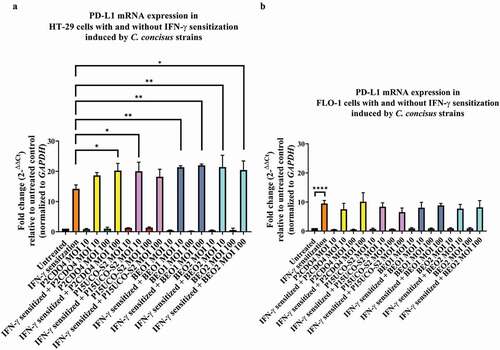
Figure 2. IL-8 production by HT-29 cells with and without IFN-γ sensitization induced by C. concisus strains after 4 hours.Concentrations of IL-8 in the cell culture supernatants of HT-29 cells without (A) and with IFN-γ (B) sensitization were measured by ELISA after 4 hours of incubation with C. concisus strains (P2CDO4, P15UCO-S2, BEO1 or BEO2). The dash-line bar indicates significance test compared with untreated HT-29 cells and the straight-line bar indicates significance test compared with IFN-γ sensitized HT-29 cells. One-way analysis of variance (ANOVA) with Dunnett’s test was performed. Graphs are representative of averages of triplicate experiments ± standard error (* = P < 0.05; ** = P < 0.01; **** = P < 0.0001 indicates statistical significance). MOI: multiplicity of infection
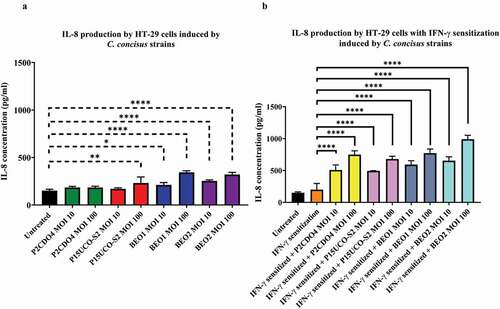
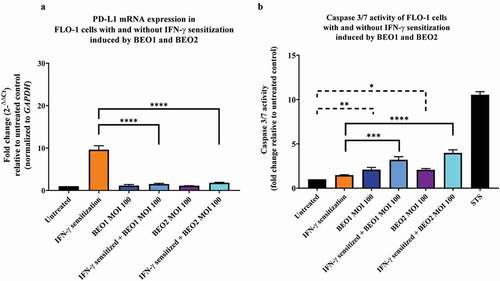
Figure 3. PD-L1 mRNA expression and caspase 3/7 activities in FLO-1 cells with and without IFN-γ sensitization induced by C. concisus BEO1 and BEO2 at MOI 100 after 24 hours. (A) The mRNA levels of PD-L1 in FLO-1 cells were measured using qRT-PCR. (B) The apoptotic effect of BEO1 and BEO2 on FLO-1 cells were determined by measuring caspase 3/7 levels using CellEvent™ caspase 3/7 green detection reagent. Staurosporine (STS) treated FLO-1 cells were used as the positive control. One-way analysis of variance (ANOVA) with Dunnett’s test was performed. Graphs are representative of averages of triplicate experiments ± standard error (* = P < 0.05; ** = P < 0.01; *** = P < 0.001 **** = P < 0.0001 indicates statistical significance). MOI: multiplicity of infection