Figures & data
Figure 1. (A) Chemical structure of II-6s. (B) Synthesis of compound II-6s. Reagents and conditions are as follows: (I) (R)-epichlorhydrin, AcOH, 75°C, 8 h; (II) KF, MeCN, reflux, 5 h; (III) 2-methyl-1-(naphthalen-2-yl)propan-2-amine hydrochloride, Et3N, EtOH, reflux, 7 h
Table 1. Primers used for quantitative real-time PCR
Table 2. MICs, MBCs, MBICs and MBRCs of test agents against E. faecalis strains
Figure 2. Kinetic killing effect of test agents on E. faecalis planktonic cultures. The concentrations of II-6s, NaOCl and CHX were at MBC values respectively. The untreated control was E. faecalis grown in BHI medium in the absence of II-6s, NaOCl or CHX. Data are means ± SD (n = 3)
Figure 3. MIC values of test agents against E. faecalis. MICs were repeatedly measured from passage 0 (P0) to passage 10 (P10)
Table 3. Dilution coefficient of test agents
Figure 4. Cytotoxicity of test agents on macrophages 264.7, human periodontal ligament fibroblasts and human osteosarcoma MG63 cells. (A1-A3) Relative growth rate of RAW264.7, hPLFs and MG63 treated with II-6s; (B1-B3) Relative growth rate of RAW264.7, hPLFs and MG63 treated with CHX; (C1-C3) Relative growth rate of RAW264.7, hPLFs and MG63 treated with NaOCl. Data are means ± SD (n = 3). RAW264.7, macrophages RAW264.7; hPLFs, human periodontal ligament fibroblasts; MG63, human osteosarcoma MG63 cells
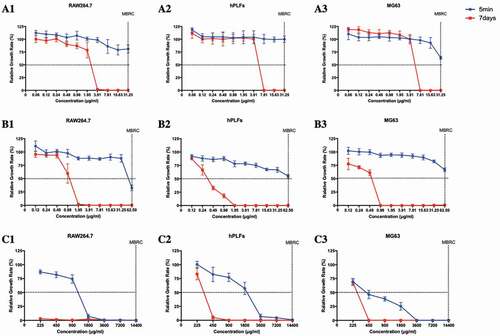
Figure 5. Effects of sub-MIC level of II-6s on the expression of virulence-associated genes in E. faecalis. Data are presented as means ±SD (n = 3). *, P< 0.05; ****, P< 0.0001 as compared to the untreated control group
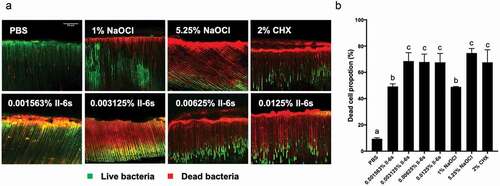
Figure 6. The antimicrobial effects of II-6s against 21-day-old E. faecalis biofilms in infected dentin tubules. (A) Representative image of dead/live bacteria within the dentinal tubules after treatment; live bacteria stained green; dead bacteria stained red; scale bar = 50 μm; (B) Proportion of dead bacteria after treatment; data are presented as mean ± SD (n = 5). Different lowercase letters indicate statistically significant differences between different treatment groups (P < 0.05)