Figures & data
Figure 1. Flowchart of the study.
Table 1. Demographic characteristics and oral examination results of OPD (n = 20) and homecare (n = 20) patients
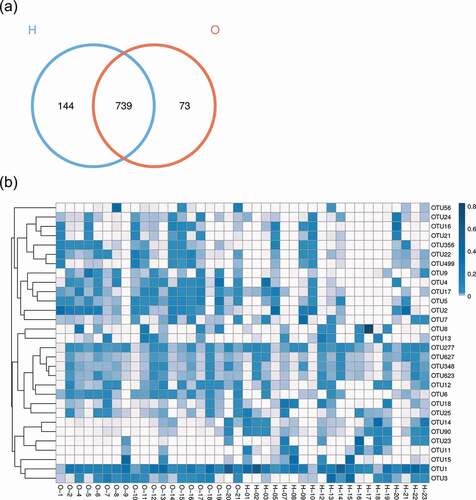
Figure 2. Comparison of the microbiota composition between OPD and home-care groups. (a) Venn diagram of species composition from the two groups. H and O indicate home-care and OPD patients, respectively. (b) OTU heat map showing different microbiota composition between the two patient groups. Color shades indicate the relative abundance of each OTU after normalization. (c) Chao1 index showing higher species abundance in the OPD group compared to the home-care group. (d) Shannon index indicating higher species evenness in the OPD group compared to the home-care group.
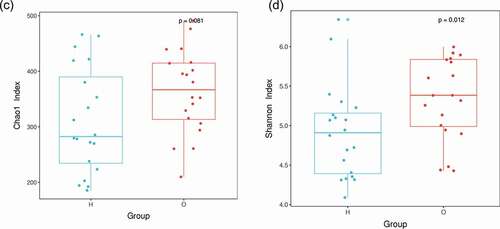
Figure 3. Taxonomic analysis showed distinct bacterial taxa between OPD and home-care groups. (a) Relative abundance of annotated bacterial phyla shown per group (left) and per patient (right). (b) Species distribution heat maps present similarities and differences of bacterial genera per group (left) and per patient (right). Some genera were abundant in homecare patients but not in OPD patients, and vice versa. O, OPD group; H, home-care group.
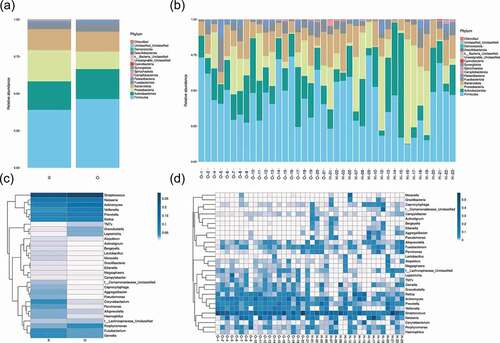
Figure 4. Beta-diversity and dimensionality reduction indicates a more stable microbial population among OPD patients compared to the home-care group. (a) PCoA of Bray-Curtis distance with each point representing a sample. The distance between a given pair of points indicates their similarity. (b) PCA of OTU abundances indicates variation among samples. The OPD group was more concentrated than the home-care group, indicating a more stable bacterial population. (c) NMDS plot representing differences between all samples based on Bray-Curtis dissimilarity between samples. (d) ANOSIM was used to compare ‘between group’ vs. ‘within-group’ differences. The two open circles indicate statistical significance (p-value ≤ 0.05). O, OPD group; H, home-care.
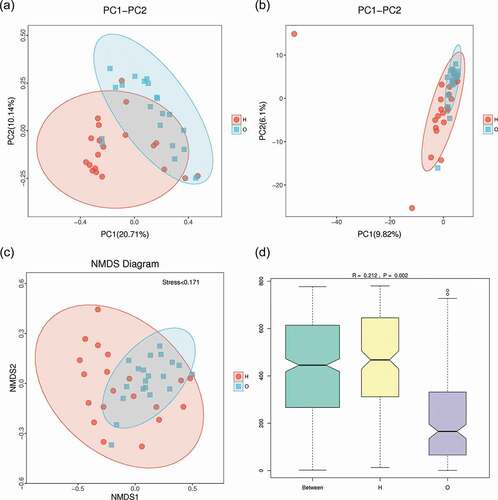
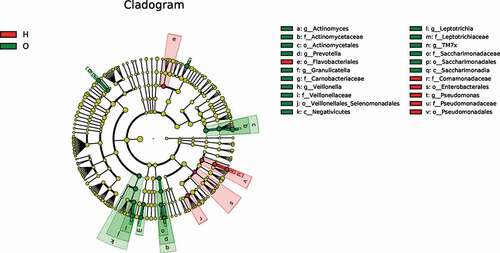
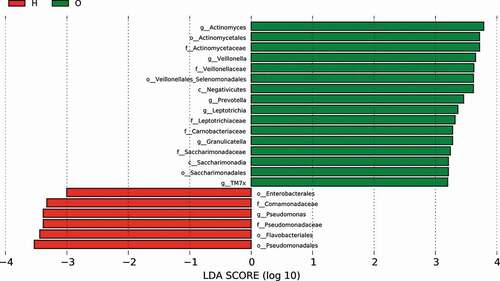
Figure 5. LefSe analysis showing distinct bacterial biomarkers between OPD and home-care groups. (a) Taxonomic cladogram showing distinct bacterial taxa from the two patient groups. (b) LDA scores representing significant differences in the abundance of bacterial taxa between the two groups. O, OPD group; H, home-care group.