Figures & data
Table 1. Clinical responses to treatment of NR and GR sites. Cell values are mean ± standard deviation (range)
Figure 1. The effect of treatment on the bacterial composition of subgingival plaque as determined by Principal Coordinates Analysis (PCoA) using unweighted (a) and weighted (b) UniFrac distance measures. Samples were taken immediately prior to non-surgical periodontal treatment of matched NR (purple) and GR (blue) sites. Three months after treatment samples were again taken from the same matched NR (green) and GR (red) sites.
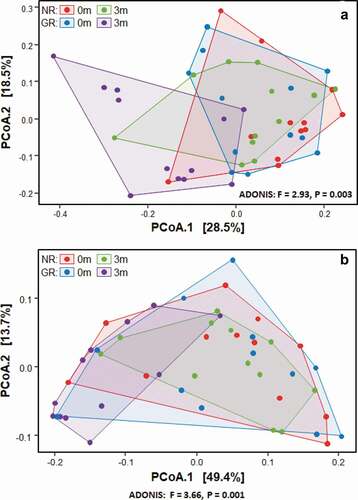
Figure 2. Comparison of subgingival plaque bacterial diversity before (0 m) and three months (3 m) after non-surgical periodontal treatment. All three analyses; Shannon (a), Inverse Simpson (b) and Fisher (c) showed a significant decrease in bacterial diversity after treatment in GR but not NR sites. There was no difference in bacterial diversity between GR and NR sites prior to treatment.
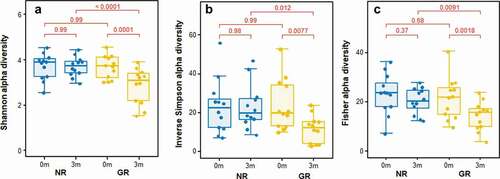
Figure 3. Differences in relative abundances of the 20 most abundant bacterial genera in subgingival plaque prior to and in response to non-surgical periodontal treatment in NR and matched GR sites. Subgingival plaque samples were taken immediately prior to treatment (0 m) and three months after treatment (3 m). There was little difference in relative abundance of any of the genera prior to treatment between the NR and matched GR sites. The x-axis depicts the relative change in abundance as a percentage of the total.
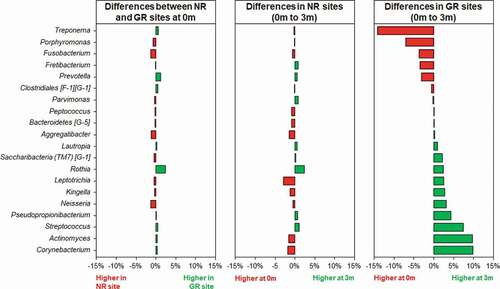
Figure 4. The relative abundances of the 20 most abundant taxa at a species level in subgingival plaque prior to non-surgical periodontal treatment (0 m) and three months after treatment (3 m) in NR and matched GR sites.
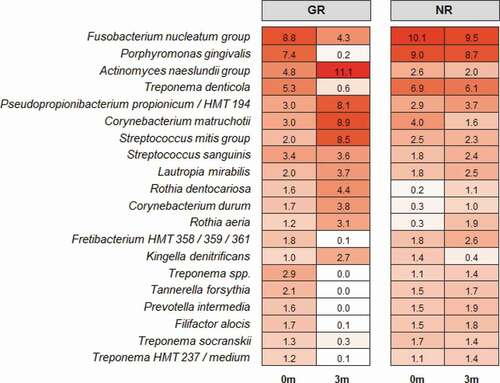
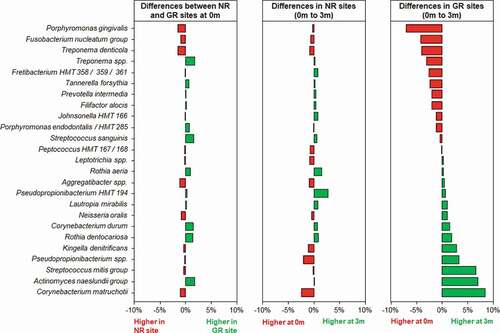
Figure 5. Differences in the relative abundances of the 25 most abundant bacterial taxa at a species level in subgingival plaque prior to and in response to non-surgical debridement treatment in NR and matched GR sites. Subgingival plaque samples were taken just prior to treatment (0 m) and three months after treatment (3 m). There was little difference in relative abundance of any of the taxa prior to treatment between the NR and matched GR sites. The x-axis depicts the relative change in abundance as a percentage of the total.