Figures & data
Figure 1. General workflow of the saliva sample preparation and MALDI-TOF analysis. (a) Method optimization. Initially, a range of different protein concentrations was evaluated to determine the optimal protein concentration. Subsequently, three MALDI matrices with better performances were evaluated and α-cyano-hydroxycinnamic acid (HCCA) was selected as the optimal one. (b) The sample cohort consisted of four groups: severe (ICU), mild (emergency room), moderate (department) and control. The COVID-19 diagnosis was confirmed by RT-qPCR of nasopharyngeal swabs. Saliva samples were obtained using a salivette and virus inactivation was performed in an BSL-3 laboratory. Direct spotting of saliva on the MALDI plate was performed and the proteomic profile was acquired using a MALDI-TOF MS instrument. The MALDI-TOF spectra were pre-processed and analyzed in R environment, where statistically significant protein peaks were used to train multiple machine learning algorithms for group classification (training phase). The model with the best performances was used to analyze independent samples and calculate the accuracy, sensitivity and specificity of the model (validation phase).
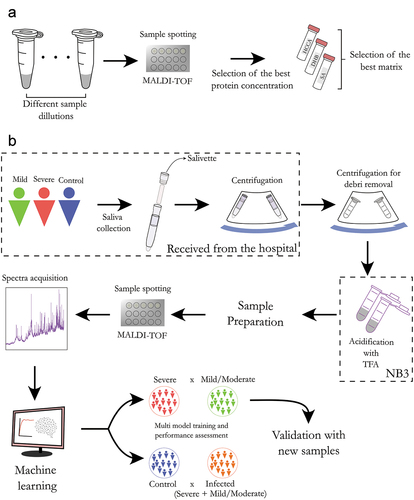
Table 1. Clinical characteristics of the 192 COVID-19 patients investigated
Figure 2. (a) Mean spectra profile obtained from three different samples in triplicate at different concentrations (1:1, 1:2, 1:5, 1:10 and 1:100 sample to TFA 0.1% ratio). (b) Maximum intensity of the spectra for each concentration. (c) The number of peaks identified for each concentration. (d) Mean spectra profile of one sample in triplicate for each matrix tested. (e) Maximum intensity of the spectra for each matrix. (f) Number of peaks detected for each matrix. (g) PCA of the samples that were analyzed with 0.2 μg of proteins. (h) PCA of the samples using 1ul of saliva irrespective of the protein concentration. In Figure 2(g,h), MILD refers to MILD/MODERATE condition.
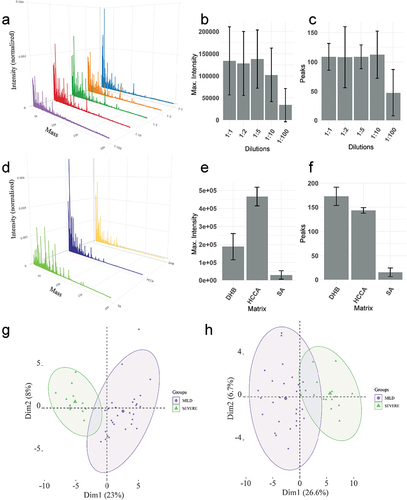
Figure 3. (a) MALDI-TOF MS mean spectrum of the saliva of the MILD/MODERATE group. (b) MALDI-TOF MS mean spectrum of the saliva of the SEVERE group. (c) MALDI-TOF MS mean spectrum of the saliva of the control group. (d) MALDI-TOF MS mean spectrum of the saliva of the infected group (MILD/MODERATE+SEVERE). (e) PCA for the control and infected groups. (f) The most ranked peaks after information gain filtering. (g) Spectra from the region of the highest ranked peak (1633). (h) Best ROC curves obtained from model training with control and infected samples. (i) Best PR curves obtained from model training with control and infected samples.
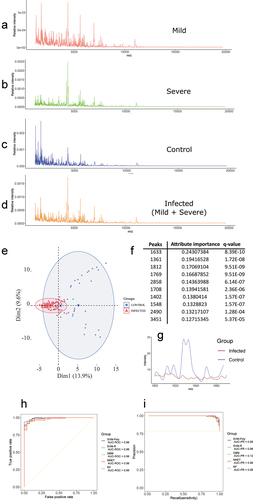
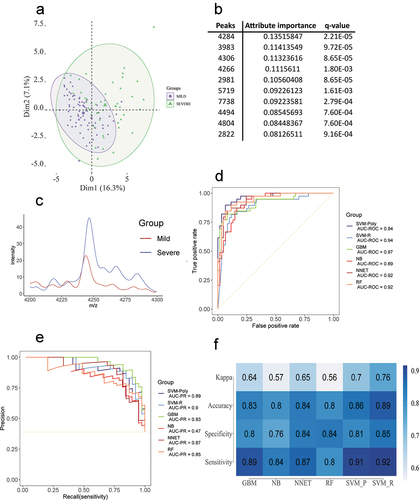
Figure 4. (a) PCA obtained through the analysis of the MILD/MODERATE and SEVERE conditions. (b) The 10 most relevant peaks were obtained through information gain filtering. (c) Comparison between MILD/MODERATE and SEVERE of the most discriminant peak. (d) Best ROC curves obtained from the model training. (e) Best PR curves obtained from the model training. (f) Mean accuracy, mean sensitivity, mean specificity and mean kappa were obtained in the model training step.