
Figures & data
Figure 1. Agarose gel of PCR products of P. aeruginosa strains compared to positive and negative controls.
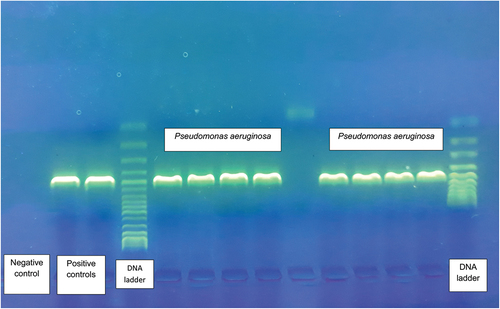
Figure 2. Number of DUs positive for P. aeruginosa and Pseudomonas spp. for both samples at each floor in light gray. In dark gray, number of DUs contaminated by antibiotic resistant strains. In the center column the total number of DU’s analyzed on each floor. The same synthesis for the control.
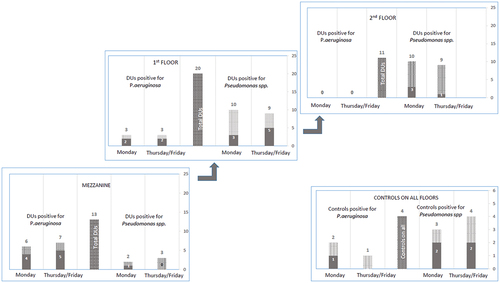
Table 1. Summary of the resistance phenotype of the analyzed strains.