Figures & data
Figure 1. The micro-CT images and analysis of 3- and 6-month-old Itgb6−/− and WT mouse molar teeth.
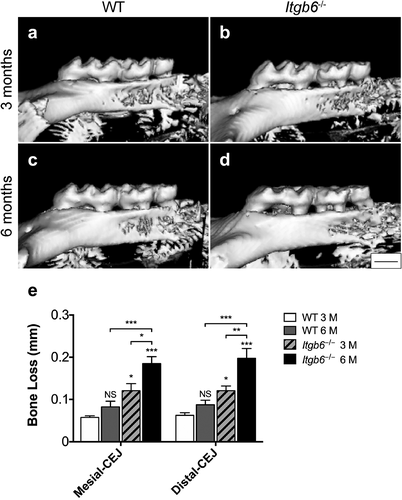
Figure 2. The histological view of periodontal tissues in 3- and 6-month-old Itgb6−/− and WT mice.
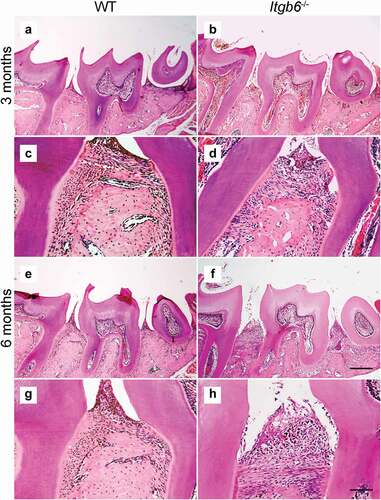
Figure 3. The alpha diversity measurements of the oral microbiome in 3- and 6-month-old Itgb6−/− and WT mice.
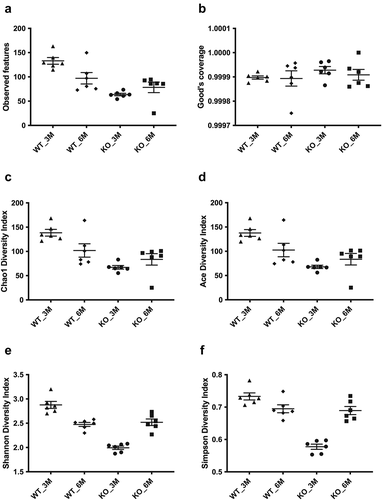
Figure 4. The beta diversity patterns of Principal Coordinate Analysis (PCoA).
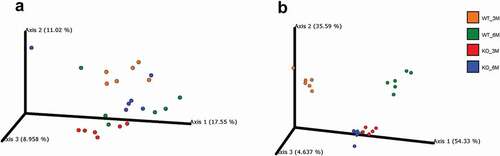
Figure 5. The taxonomic composition of the oral microbiome in 3- and 6-month-old Itgb6−/− and WT mice.

Table 1. The ANCOM results and percentile abundances of features in each group.
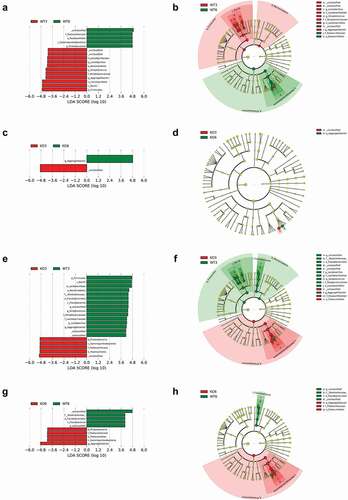
Figure 6. The Linear Discriminant Analysis Effect Size (LEfSe) of 3- and 6-month-old Itgb6−/−and WT mice.
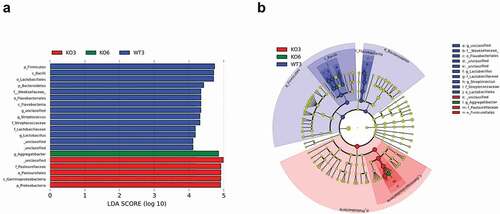
Figure 7. LEfSe analysis of oral microbiomes in 3- and 6-month-old Itgb6−/− and WT mice.