Figures & data
Table 1. Subjects’ demographics and dental clinical characteristics for patients at moderate risk for IE who had IE or did not, and healthy controls.
Figure 1. Analytical design.
Table 2. Alpha-diversity analyses show significant differences for HC vs. IE and DC vs. IE comparisons.
Table 3. PERMANOVA p-values for healthy controls, non-IE disease controls, and IE patient comparisons show significant beta-diversity changes.
Figure 2. Alpha- and beta-diversity results. Alpha-diversity boxplots of IE, HC, and DC groups. Principal Coordinates Analysis (PCoA) of beta-diversity comparisons. a. Boxplots showing the total species (top left), species richness (top right), Shannon diversity indices (bottom left), and Simpson diversity indices (bottom right) of oral samples taken from the buccal mucosa (B), saliva (S), and tongue (T) (BST sample data combination) for patients diagnosed with infective endocarditis (IE; red), non-IE disease controls (DC; orange), and healthy controls (HC; green). b. Principal coordinates analysis (PCoA) of relative abundance data for sample site data combinations of buccal mucosa (B), saliva (S), and tongue (T) combination for a. healthy controls (HC) (green triangles) vs. infective endocarditis (IE) patients (red squares), b. HC vs. non-IE disease controls (DC) (orange circles), and c. DC vs. IE patients. Other comparisons included d. subgingival plaque (sub-g) data combined with supragingival plaque (supra-g) or e. sub-g data alone for DC vs. IE patients.
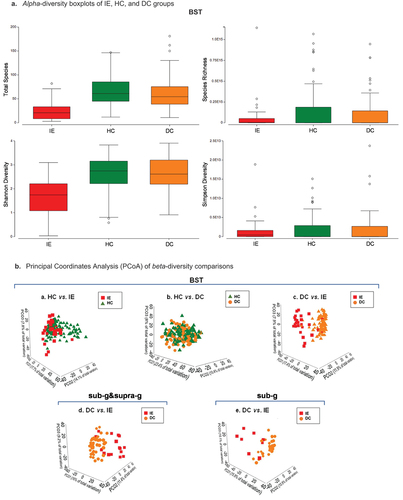
Figure 3. LEfSe histograms comparing HC, IE, and DC groups. HC vs. IE. HC vs. DC. DC vs. IE. Linear discriminant analysis (LDA) effect size (LEfSe) of healthy controls (HC), non-IE disease controls (DC), and infective endocarditis patients (IE) based on relative abundance data. Comparisons HC vs. IE (a), HC vs. DC (b) and DC vs. IE (c) were performed. Samples sites included buccal mucosa (B), saliva (S), tongue (T), subgingival plague (sub-g), and/or supragingival plaque (supra-g). LEfSe input consisted of ‘Diagnosis’ (disease status HC, DC, and/or IE) as LEfSe ‘Class’ option and ‘Subject’ as LEfSe ‘Subject’ option. Using the all-against-all strategy, the factorial Kruskal-Wallis and pairwise Wilcoxon signed rank test were set at a Monte-Carlo significance of α = 0.05 to calculate LDA scores. The log LDA was set at a threshold of > 4.0 for all comparisons other than HC vs. DC which was set at a threshold > 2.0. An asterisk (*) denotes significance of Mann-Whitney U-test. *< 0.05; **< 0.01; ***< 0.001.
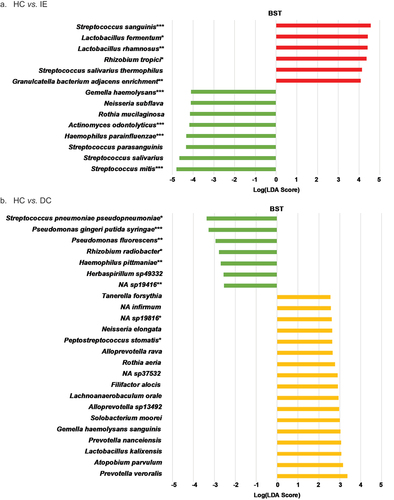
Figure 3. (Continued.)
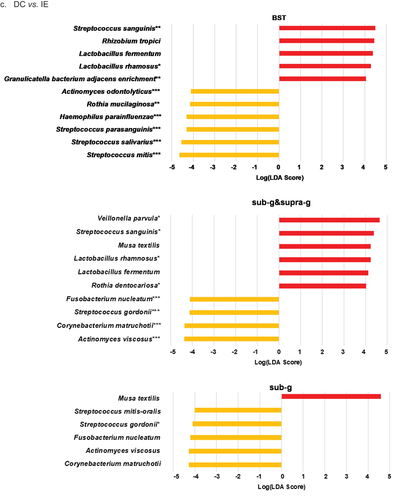
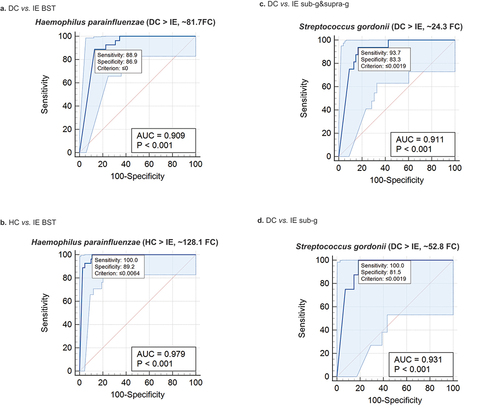
Figure 4. Receiver Operating Characteristic (ROC) curve analysis. DC vs. IE BST. HC vs. IE BST. DC vs. IE sub-g&supra-g. DC vs. IE sub-g.Receiver Operating Characteristic (ROC) curves based on relative abundance data were determined for each comparison of healthy controls (HC), non-IE disease controls (DC), and/or infective endocarditis patients (IE) groups for the sample data combinations of buccal mucosa (B), saliva (S), tongue (T), subgingival plaque (sub-g) and/or supragingival plaque (supra-g). No species were found to have an area under the curve > 0.6 for the HC vs. DC BST comparison. Mean relative abundance changes of each species probe in the form of fold changes (FC) are shown for each group. The (>) sign is used to depict the group with highest abundance on average. The criterion is the cut-off point selected to discriminate between two populations.