
Figures & data
Figure 1. (a) Experimental balanced design for determination of RNA expression profiles of dental plaque microbiome and oral mucosa, and dental plaque microbiome abundance data, in healthy volunteers. (b) Overall analytical design.
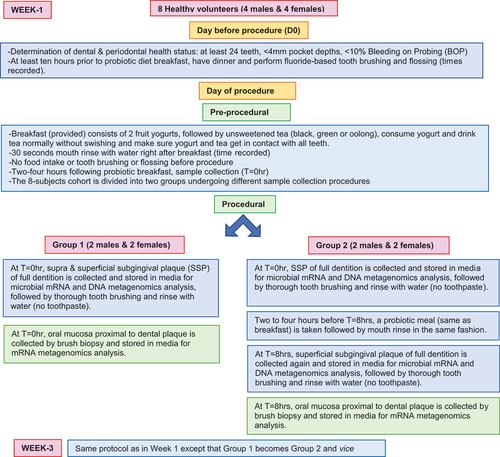
Table 1. Healthy volunteers’ cohort demographics and multiple sample collection.
Figure 1. (Continued).
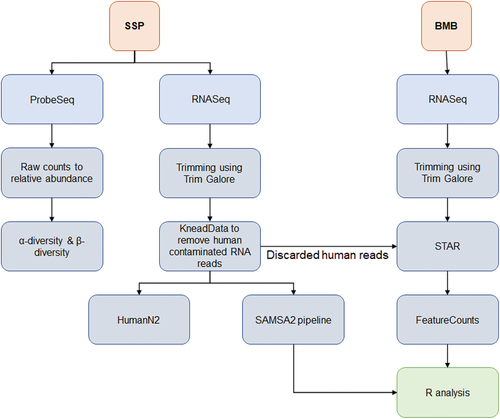
Table 2. Alpha- and beta-diversity analysis.
Figure 2. Heatmap and PCA plots comparing AM to PM SSP data as determined by DESeq2 analysis using SAMSA2 pipeline. a. organism Heatmap b. organism PCA c. function Heatmap d. function PCA.
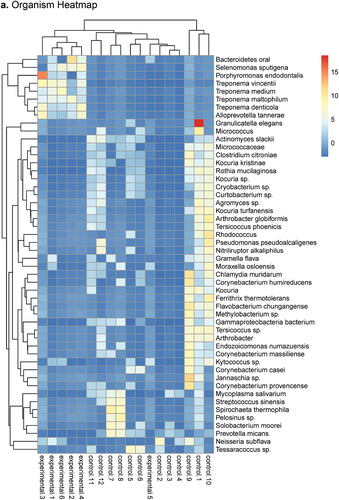
Figure 2. (Continued).
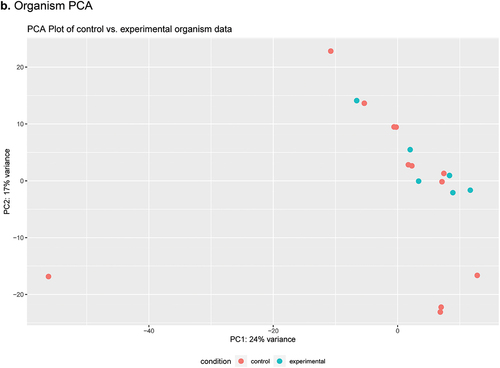
Figure 3. Combined histograms showing top 30 most abundant taxa and functions using the SAMSA2 pipeline on dental plaque bacterial RNA-Seq data a. organism level b. function level.
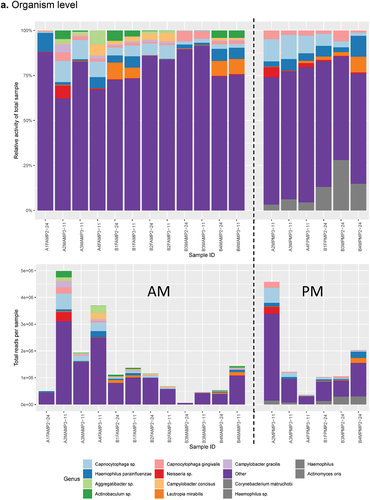
Figure 3. (Continued).
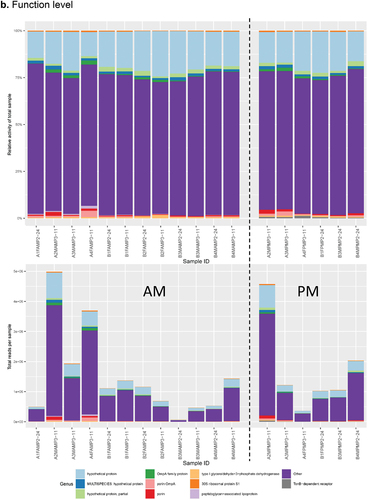
Figure 2. (Continued).
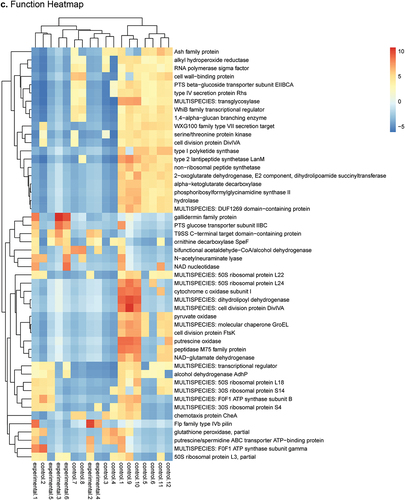
Figure 2. (Continued).
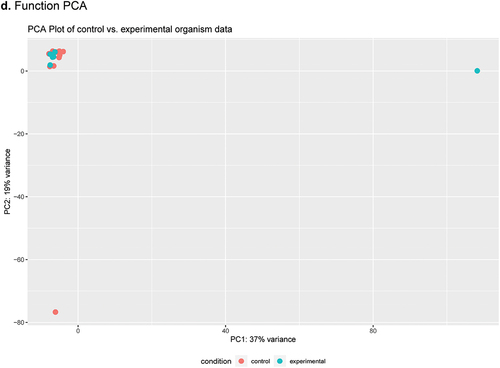
Table 3. Significant bacterial gene expression-derived pathway enrichment determined by LEfSe analysis from AM to PM.
Supplemental Material
Download Zip (3.1 MB)Data availability statement
All data and accompanying files are available via the Translational Research Lab Github repository (https://github.com/mbeckm01/RNASeq).