
Figures & data
Table 1. The result of one-way analysis of variance (ANOVA) for age and seed dental indices between the study groups.
Table 2. Alpha diversity (assessed by richness Chao1, Shannon and Simpson), and beta diversity indices (estimated by the Bray-Curtis, Jensen-Shannon and Jaccard indices) in the studied groups (group I vs. Group II vs. Group III).
Figure 1. Relative percentage distribution of bacteria from the mouth on COVID-19 infection and taking antimicrobials at the phylum level (L2) depending on clinical material: saliva (), tongue ridge (), subgingival plaque () and supragingival plaque (), respectively.
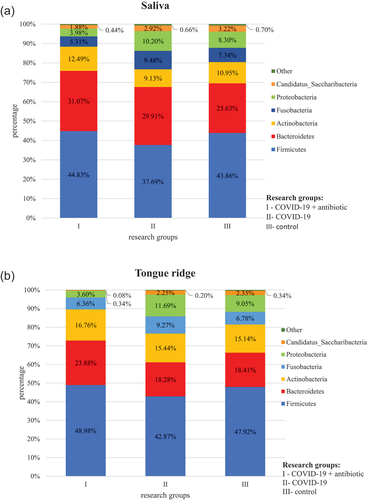
Figure 1. (Continued).
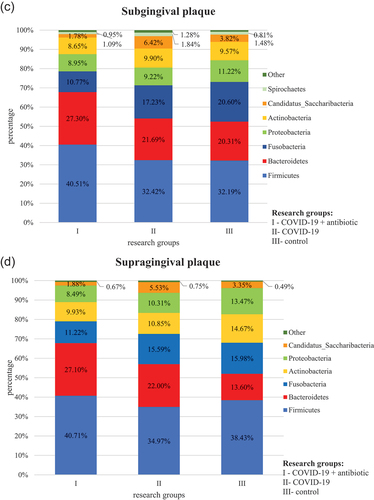
Figure 2. Relative percentage distribution of bacteria from the mouth on COVID-19 infection and taking antimicrobials at the genus level (L6) depending on clinical material: saliva (), tongue ridge (), subgingival plaque () and supragingival plaque (), respectively.
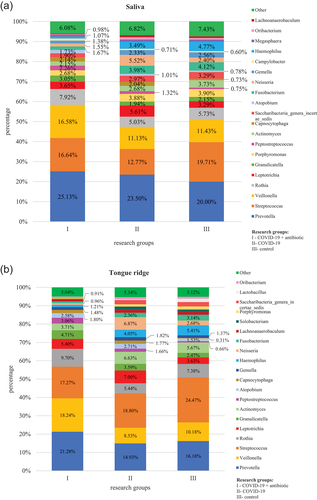
Figure 2. (Continued).
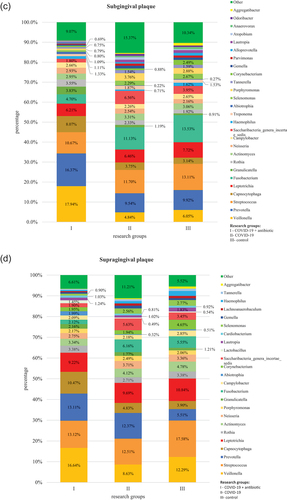
Figure 3. Increase and decrease the number of studied bacteria at the phylum (L2) and genus (L6) level in COVID-19 convalescents who received antibiotics during hospitalization compared to the control (left side of figure) and COVID-19 infection without antimicrobial treatment compared to the control group (right side of the figure) taking antimicrobials depending on clinical material: saliva, tongue ridge, subgingival plaque, supragingival plaque, respectively.
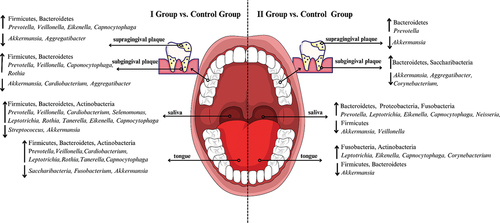
Table 3. Correlations between selected dental indices and types of bacteria in the examined clinical materials for the groups of patients included in the study.