
Figures & data
Figure 1. The effect of est816 on A. actinomycetemcomitans biofilm formation and virulence factor release. (a) confocal microscopy visualization of the effect of 6, 12, 24 U ml−1 and inactivated lactonase est816 on A. actinomycetemcomitans biofilm growth (original magnification × 20). (b) SEM images of A. actinomycetemcomitans biofilm pretreated with 6, 12, 24 U ml−1 and inactivated est816 (original magnification × 1000 and × 10,000). (c) The growth curve of planktonic A. actinomycetemcomitans cultured with 6, 12, 24 U ml−1 and inactivated lactonase est816. (d) The quantitative analysis of crystal violet staining measurement. (e-f) real-time PCR analysis of the effect of 6, 12 or 24 U ml−1 est816 on the expression of pgaA, lktA and cdtB of A. actinomycetemcomitans in planktonic form and biofilm condition (est816 groups were compared with the control group, *p < 0.05, **p < 0.01, ***p < 0.001). Data are the average of triplicate measurements, and error bars represent the standard deviation.
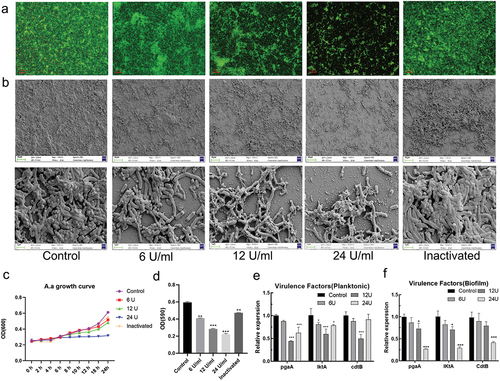
Figure 2. The cell toxicity and anti-inflammatory effects of est816. (a-b) CCK-8 results showing the proliferation of HGFs and HGEs treated with 6, 12, or 24 U ml−1 est816 for 1, 3, 5, and 7 days. (c-d) ELISA showing the protein expression of TNF-α (c) and IL-6 (d) in the supernatant of HGFs for 3 and 12 h. (e-f) ELISA showing the protein expression of TNF-α (e) and IL-6 (f) in the supernatant of HGEs for 3 and 12 h (A. actinomycetemcomitans group and est816 groups were compared with the control group, *p < 0.05, ***p < 0.001; est816 groups were compared with the A. actinomycetemcomitans group, #p < 0.05, ###p < 0.001). Error bars of panels represent the standard deviation.
Figure 3. The results of micro-CT showing the effect of est816 on periodontitis in rats. (a-b) micro-CT exhibiting the bone loss at root bifurcation (a1, b1 and c1) and at alveolar bone crest (d1, e1 and f1) in the control, A. actinomycetemcomitans, and est816+A. actinomycetemcomitans groups after 1 and 2 months of treatment; (blue arrows point the region of root bifurcation; red arrows indicate the alveolar crest); (c-e) light and volume measurements showing alveolar crest resorption, bone loss of root bifurcation, and BV/TV of the DOI region in the control, A. actinomycetemcomitans, and est816+A. actinomycetemcomitans groups during 1 and 2 months, respectively (A. actinomycetemcomitans group and est816 + A. actinomycetemcomitans groups were compared with the control group, *p < 0.05, **p < 0.01, ***p < 0.001; est816 +A. actinomycetemcomitans group was compared with the A. actinomycetemcomitans group, #p < 0.05, ##p < 0.01, ###p < 0.001).
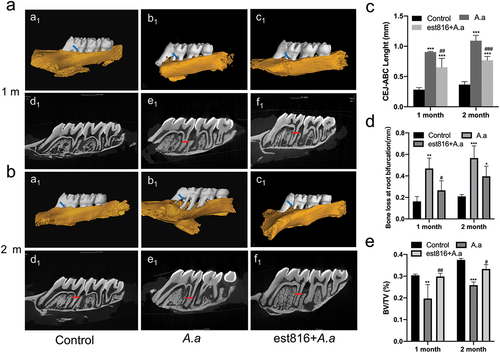
Figure 4. H&E staining and immunohistochemical analysis of MMP-9 in periodontal tissues. (a) H&E staining evaluating the inflammatory response of periodontal tissues in the region of the first and second molars of rats for 2 months (original magnification × 2.5 and × 20; blue and red arrows pointing root bifurcation and alveolar crest, respectively; the black boxes represent the magnification area). (b) Immunohistochemical analysis exhibiting MMP-9 expression in periodontal tissues in the region of the first and second molars of rats for 2 months; (original magnification × 2.5 and × 40; AB points to alveolar bone; CT points to cementum).
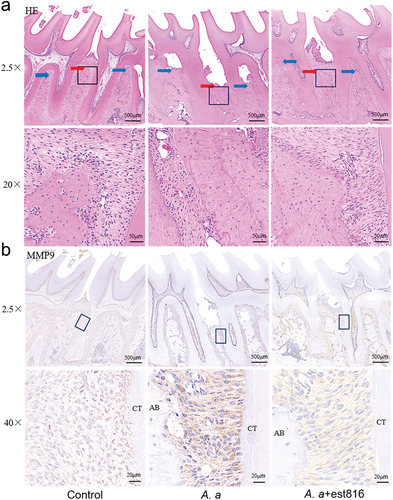
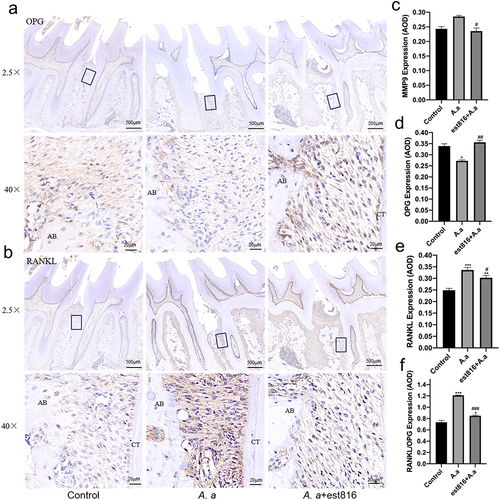
Figure 5. Immunohistochemical staining of OPG and RANKL and the averaged optical density (AOD) of bone loss-related markers. (a-b) immunohistochemical analysis exhibiting the OPG and RANKL expression of periodontal tissues of rats for 2 months; (original magnification × 2.5 and × 40; the black boxes represent the magnification area; AB, alveolar bone; CT, cementum); (c – f) the averaged optical density analysis showing the expression intensity of MMP-9, OPG, RANKL, and RANKL/OPG in periodontal tissues for 2 months in each group; (A. actinomycetemcomitans group and est816 + A. actinomycetemcomitans groups were compared with the control group, *p < 0.05, **p < 0.01, ***p < 0.001; est816 +A. actinomycetemcomitans group was compared with the A. actinomycetemcomitans group, #p < 0.05, ##p < 0.01, ###p < 0.001). Error bars of panels (C, D, E and F) represent the standard deviation.
Supporting_Information_with_author_details.docx
Download MS Word (327.9 KB)Data availability statement
The data that support the findings of this study are openly available.