
Figures & data
Figure 1. Experimental scheme of the anaerobic incubation of (a) S. mutans ATCC 25175 (control) and (b) S. mutans and S. salivarius co-cultivation in a flow chamber. S. mutans ATCC 25175 and S. salivarius K12/S. salivarius M18 were suspended in 30 ml AS containing 0.5% sucrose (T0). After 24 h (T1), the medium was replaced with 30 ml AS containing 0.5% sucrose (a) or 30 ml AS containing 0.5% sucrose and the probiotic bacteria S. salivarius K12 and/or S. salivarius M18 (b). Bacteria were incubated for additional 24 h (T2). Planktonic bacteria were quantified at the beginning of the experiment (T0) and after 48 h of incubation (T2). The biofilm formed on the HA discs after 48 h (T2) was analyzed by determining the CFU/ml, SEM, and CLSM.
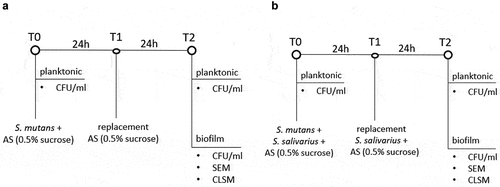
Table 1. Characteristics of 16S rRNA gene-directed oligonucleotide probes used for FISH.
Figure 2. Representative SEM images of the biofilm-coated HA discs after 48 h of anaerobic incubation in the flow chamber. S. mutans monoculture biofilm (negative control) formed on HA discs with brackets (a) and without brackets (c). S. salivarius M18 and S. mutans mixed biofilm formed on HA discs with (b) and without bonded orthodontic brackets (d) after 48 h of co-cultivation. For biofilm on HA discs with brackets, images were taken at x20. For biofilm on HA discs without brackets, images were taken at x50 and x3000.
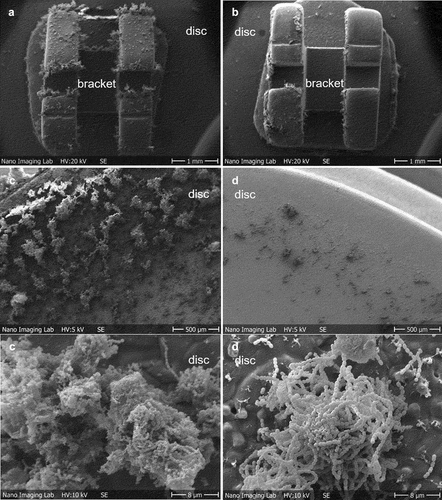
Figure 3. The composition of biofilm formed on HA discs after 48 h of incubation as monitored by FISH. Representative CLSM images of the biofilm formed by S. salivarius M18 (a) and S. mutans ATCC 25175 (b) monocultures, as well as S. mutans and S. salivarius M18 mixture after co-cultivation (c). Biofilms were labeled with MUT590 (green) and STR405 (red) probes.
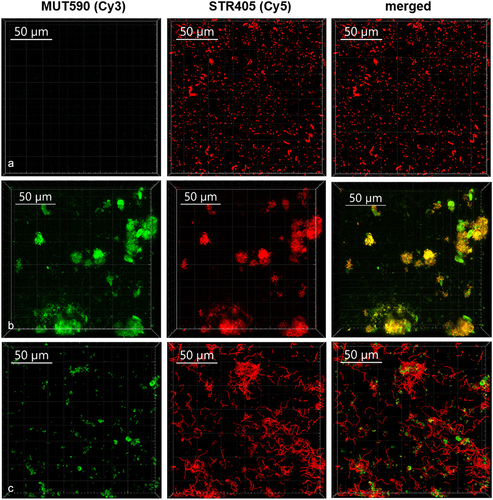
Figure 4. Antimicrobial activity of S. salivarius K12 and/or M18 against S. mutans in a co-cultivation model. (a) bacterial viability measured as CFU/ml for planktonic cells at the beginning (T0) and after 48 h (T2) of co-cultivation of S. mutans ATCC 25175 (light grey column) with S. salivarius K12 (grey column, left right diagonal hatch pattern), M18 (grey column, right left diagonal hatch pattern) resp. and K12/M18 mixture (dark grey column, crossed line hatch pattern). S. mutans monoculture was used as a control (light grey column). (b) bacterial viability measured as CFU/ml for biofilm-associated cells after 48 h (T2) of co-cultivation of S. mutans (light grey column) with S. salivarius K12 (grey column, left right diagonal hatch pattern), M18 (grey column, right left diagonal hatch pattern) and resp. K12/M18 (dark grey column, crossed line hatch pattern). S. mutans ATCC 25175 monoculture 48 h biofilm was used as a control (light grey column).
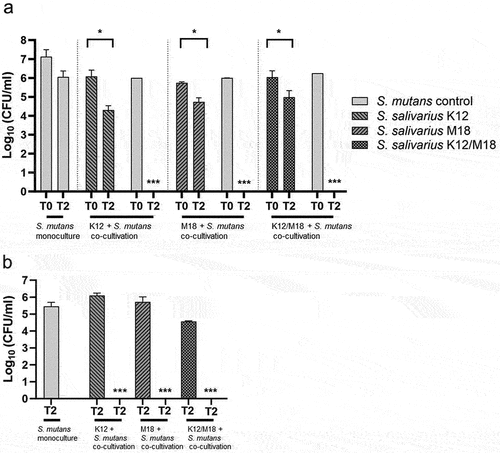
Table 2. Inhibition of bacterial growth by S. salivarius K12 and M18 as determined by the simultaneous antagonism test. (−) No inhibition; (+) slight inhibition (1–2.5 mm); (++) inhibition (2.5–4 mm); (+++) strong inhibition (4–11.0 mm).