
Figures & data
Figure 1. The relationship between epithelial junction proteins and FTL as well as protein expression in periodontitis gingiva tissues. (a) Heatmaps of FTL, OCLN, CDH1 and ZO-1 expression in healthy and periodontitis gingiva tissues in the GSE10334 (upper panel) and GSE16134 (lower panel). Red for up-regulated and blue for down-regulated gene expression. (b) The correlation of FTL with differentially expressed epithelial junction proteins in periodontitis tissues of OCLN, CDH1 and ZO-1. (c) Representative immunohistochemistry images of epithelial junction proteins (ZO-1, CDH1, OCLN), FTL and GPX4 in rat gingiva tissues. (d) Analysis of immunohistochemistry staining of epithelial junction proteins (ZO-1, CDH1, OCLN), FTL and GPX4. Data are presented as mean ± SD, n = 6. Scale bars, 100 μm. **P < 0.01 vs control.
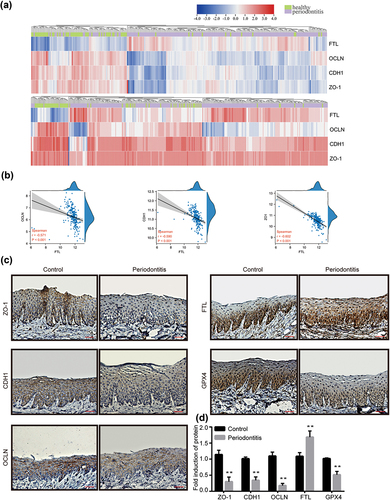
Figure 2. P. gingivalis infection depressed the expression of epithelial junction proteins in vitro. (a) Representative images of immunofluorescence with ZO-1, CDH1 and OCLN in HIOECs treated with P. gingivalis at MOI of 50 for 24 h. (b) Western blot analysis of CDH1 and OCLN in HIOECs with P. gingivalis infection at MOI of 50 for different times. (c) Analysis of immunofluorescence staining of ZO-1, CDH1 and OCLN. (d) Analysis of the protein density of CDH1 and OCLN. Data are presented as mean ± SD, n = 3, repeated three times. Scale bars, 50 μm. P. g, P. gingivalis; *P < 0.05, **P < 0.01 vs control.
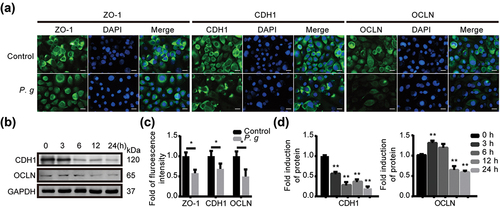
Figure 3. P. gingivalis induced ferroptosis in vitro. (a) Morphological changes of the mitochondria in HIOECs after P. gingivalis infection for 24 h. (b) Representative images of lipid peroxidation level in HIOECs with BODIPY C11 by flow cytometry (upper panel), and analysis of the lipid peroxidation level (lower panel). (c) Representative immunofluorescence images of iron level in cytoplasm and mitochondria of HIOECs treated with P. gingivalis at MOI of 50 for 24 h using FerroOrange and FerroGreen probe, respectively. (d) Analysis of the immunofluorescence intensity. (e) Western blot of SLC7A11, FTL and GPX4 in HIOECs treated with P. gingivalis at MOI of 50 for different times. (f) Analysis of protein expression level. Data are presented as mean ± SD, n = 3, repeated three times. Scale bars in (a), 1 μm. Scale bars in (c), 50 μm. P. g, P. gingivalis; *P< 0.05, **P < 0.01 vs control.
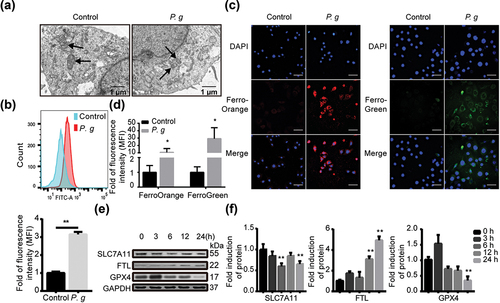
Figure 4. Effect of iron overload on epithelial cells. (a) Representative images of lipid peroxidation in HIOECs treated with FAC (200 μM) or P. gingivalis at MOI of 50 for 24 h with or without a pretreatment of iron chelator DFO (20 μM or 100 μM) for 2 h before infection using BODIPY C11 by flow cytometry. (b) Analysis of lipid peroxidation level in HIOECs. (c) GSH level in HIOECs treated with FAC (200 μM) or P. gingivalis with or without DFO (100 μM) using GSH kit with a microplate reader. (d) Representative fluorescence images of iron level in cytoplasm and mitochondria of HIOECs treated with P. gingivalis at MOI of 50 for 24 h with or without DFO (100 μM) using FerroOrange and FerroGreen probe, respectively. Scale bars, 20 μm. (e) Analysis of fluorescence intensity of HIOECs treated with P. gingivalis with or without DFO (100 μM). (f) Representative images of immunofluorescence of ZO-1, CDH1 and OCLN in HIOECs treated with FAC (200 μM) or P. gingivalis (MOI = 50) only or a pretreatment of DFO (100 μM). The nucleus was stained with DAPI. Scale bars, 100 μm. (g) Analysis of immunofluorescence intensity of ZO-1, CDH1 and OCLN in HIOECs. (h) Western blot of CDH1, OCLN, FTL and GPX4 treated with P. gingivalis or S. gordonii for 24 h. HIOECs were infected with P. gingivalis (MOI = 50) only or pretreated with DFO (20 μM or 100 μM) for 2 h before a 24 hours-infection. (i) Analysis of protein expression level of CDH1, OCLN, FTL and GPX4 treated with P. gingivalis or S. gordonii. Data are presented as mean ± SD, n = 3, repeated three times. P. g, P. gingivalis; S. g, S. gordonii; *P < 0.05, **P < 0.01 vs control, ##P < 0.01, #P < 0.05 vs P. gingivalis.
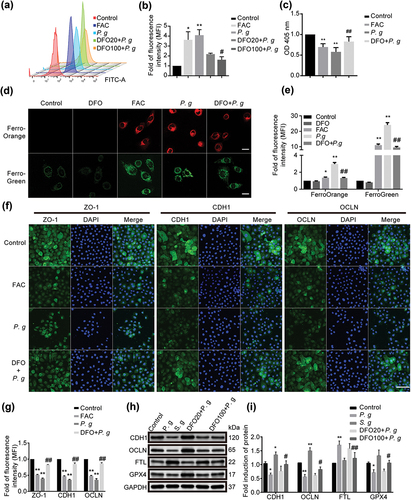
Figure 5. P. gingivalis impaired the epithelial junction proteins mediated by ferroptosis via MYB/SLC7A11/GPX4. (a) The mRNA level of SLC7A11 and GPX4 in HIOECs treated with P. gingivalis at MOI of 50 with the interference of si-NC or si-MYB by qRT-PCR analysis. (b) Western blot of CDH1, OCLN, SLC7A11 and GPX4 in HIOECs treated with P. gingivalis at MOI of 50 with the interference of si-NC or si-MYB. (c) Analysis of protein expression level of CDH1, OCLN, SLC7A11 and GPX4. (d) Western blot of CDH1 and OCLN in HIOECs treated with P. gingivalis at MOI of 50 with the interference of si-NC or si-MYB. After transfection with siRNA, the cells were pretreated with or without GPX4 inhibitor RSL3 (1 μM) for 2 h before P. gingivalis infection. (e) Analysis of protein expression level of CDH1 and OCLN. Data are presented as mean ± SD, n = 3, repeated three times. P. g, P. gingivalis; *P < 0.05, **P < 0.01 vs control, ## P < 0.05 vs P. gingivalis.
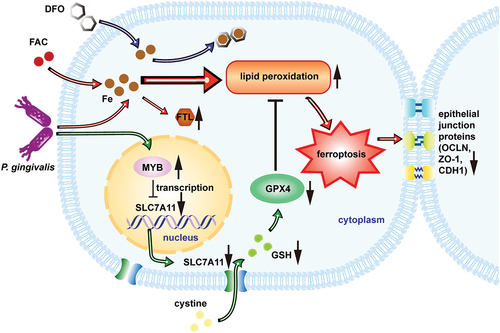
Figure 6. Proposed model that P. gingivalis induces ferroptosis and thereby impairs oral epithelial junction. P. gingivalis suppresses SLC7A11 by intervening its transcription factor MYB. Thus, it decreases GSH level and induces GPX4 loss of function. Meanwhile, excess iron followed with P. gingivalis infection causes accumulation of lipid peroxidation which should originally be cleaned by GPX4. The imbalance causes intracellular ferroptosis as well as impairment of the epithelial junction.
Supplemental Material
Download MS Word (5.9 MB)Data availability statement
The data supporting the findings of this study are available from the corresponding author upon reasonable request. Datasets presented in this study can be found in online repositories. The repository and accession numbers can be found below: NCBI (https://www.ncbi.nlm.nih.gov/), GSE10334 and GSE16134.