Figures & data
Figure 1. P. gingivalis exacerbates alveolus destruction, impairs lung function and promotes inflammation in COPD rats. (a) Flowchart of animal experiments including COPD modeling and P. gingivalis inoculation in COPD rats’ oral cavity. (b) Lung function test at the end of week 4(n = 6). (c) Lung function test at the end of week 6(n = 6). (d) Representative HE images of lung tissue. Scale bar:200 µm. (e) Quantification of MLI (mean linear intercept) in the lung tissue (n = 6). (f-g) the content of IL-8 and TNF-α in BALF and serum (n = 6). ns: no significant difference; *p < 0.05; **p < 0.01; ***p < 0.001. PEF: peak expiratory flow; PIF: peak inspiratory flow; TV: tidal volume.
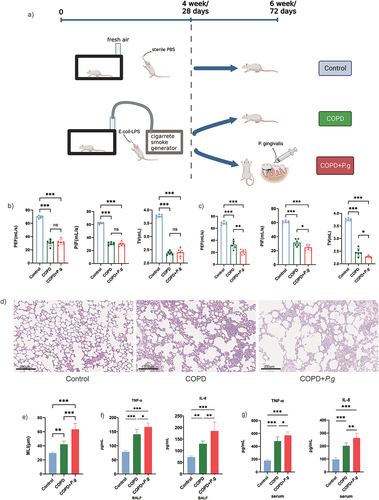
Figure 2. P. gingivalis colonizes the lungs and alters lung microbiota of COPD rats. (a) Representative immunofluorescence images of P. gingivalis/gingipains in lung tissues. Scale bar:100 µm. (b) Venn diagram of shared and unique OTUs between COPD and COPD+P.G group. (c) PCoA plot of beta diversity of lung microbiota based on weighted unifrac. (ANOSIM, r = 0.4479 p = 0.027). (d)Boxplot of alpha diversity (Chao1, observed species, and Shannon index) of lung microbiota in BALF between COPD and COPD+P.G group (n = 4). (e-f) relative abundance of lung microbiota at the species (e) and phylum (f) levels between COPD and COPD+P.G group. (g) Cladograms of LEfSe showing differences in the bacterial taxa between COPD and COPD+P.G group (LDA score > 4).
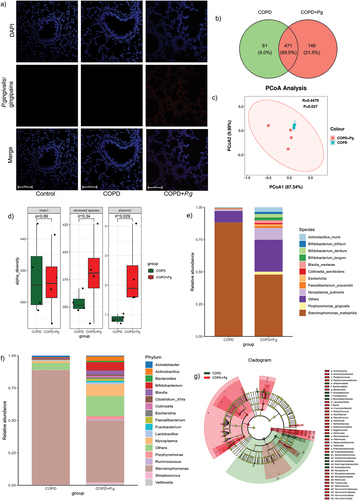
Figure 3. Hsp90α and MLKL are up-regulated in P. gingivalis-induced COPD aggravation revealed by proteomics. (a) PCA results between COPD and COPD+P.G group(n = 3). (b) Volcano plot for the differentially expressed proteins (gene names). The X-axis shows the Log2 FC, and the Y-axis shows the -Log10 P. value. The red and blue circles represent upregulated proteins and down-regulated proteins in COPD+P.G group, respectively. (c) The KEGG pathways analysis of all the upregulated differentially expressed protein in COPD+P.G group. (d) Visualization of the relationship between necroptosis pathways and up-regulated proteins (gene names).
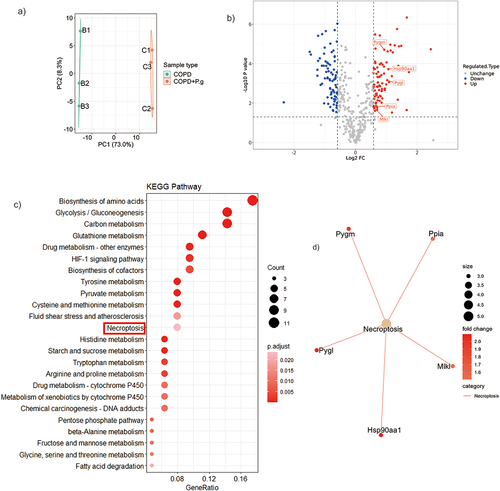
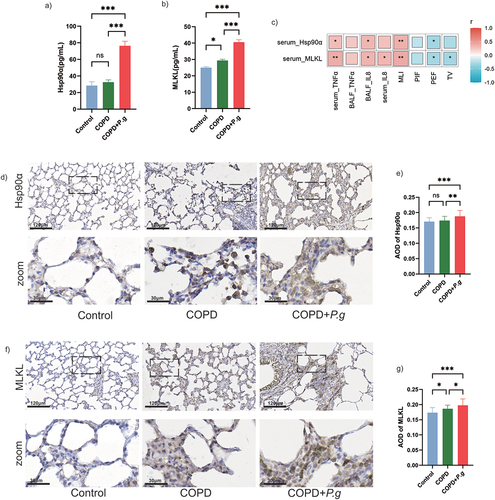
Figure 4. Hsp90α and MLKL are up-regulated in lung tissue and serum of COPD+P.G rats. (a,b) The content of Hsp90α and MLKL in serum (n = 6). (c) Spearman’s correlation analysis of Hsp90α, MLKL, IL-8, TNF-α, PIF, PEF and TV. Color from blue to red showing the negative to positive correlations. (d,f) Representative immunohistochemical staining of Hsp90α and MLKL in lung tissues. Scale bar:120 µm,30 µm. (e,g) Quantification of average absorbance of Hsp90α and MLKL positive cells in the lung tissue (n = 6). ns: no significant difference; *p < 0.05; **p < 0.01; ***p < 0.001.