Figures & data
Table 1. Baseline table between none-hypertension group and hypertension group.
Figure 1. Oral microbiota diversity between none-hypertension group and hypertension group. (a-d) alpha diversity: (a) Shannon index, (b) Simpson index, (c) observed species, (d) Chao1 index; (e) beta diversity: PCoA result based on Bray Curtis.
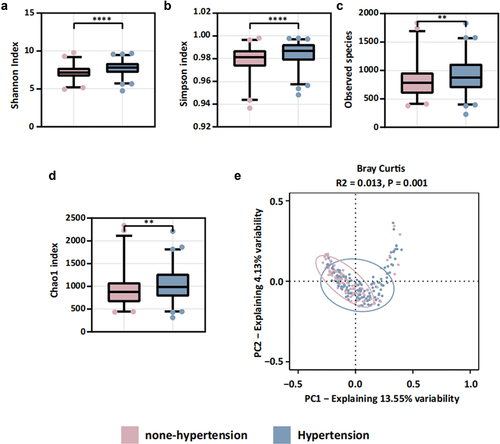
Table 2. Univariate logistic regression analysis of 24-hour blood pressure indexes and 90-day functional prognosis in none-hypertension group and hypertension group.
Figure 2. Associations between 24-hour systolic blood pressure CV and 90-d mRS using restricted cubic spline models. The risk of poor outcomes was relatively flat until around 9.19 of CV and then started to increase rapidly afterwards. OR, odds ratio; 95% CI, 95% confidence interval.
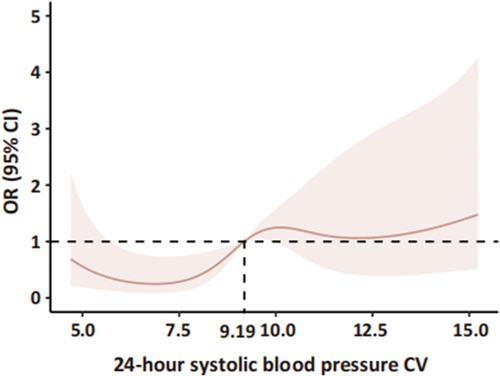
Table 3. Baseline table between lower CV group and higher CV group.
Figure 3. Oral microbiota diversity between lower CV group and higher CV group. (a-d) alpha diversity: (a) Shannon index, (b) Simpson index, (c) observed species, (d) Chao1 index; (e) beta diversity: PCoA result based on Bray Curtis.
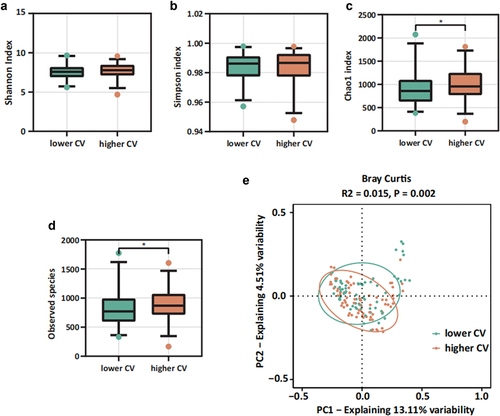
Figure 4. Oral microbiota LEfSe analysis between lower CV group and higher CV group. Orange is the higher CV group, green is lower CV group. LDA = 4.
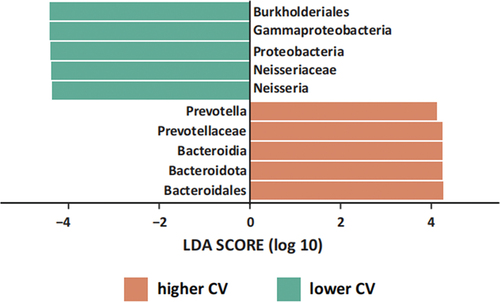
Figure 5. Energy metabolism of oral microbiota by PICRUSt2 analysis among lower CV group and higher CV group. Green, lower CV group; orange, higher CV group. Dashed lines indicate reporter score of ± 1.96, corresponding to 95% confidence in a normal distribution.
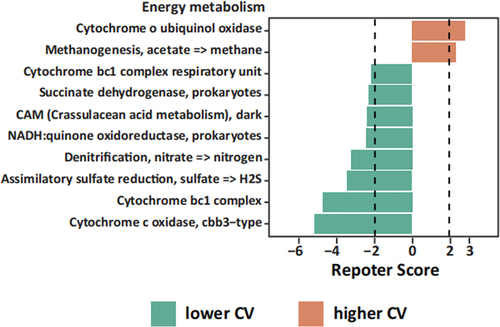
Figure 6. Results of linear regression analyses among the indexes of 24-hour systolic blood pressure and nitrate metabolic pathway scores. (a) Results of univariable linear regression analyses among the indexes of 24-hour systolic blood pressure and nitrate metabolic pathway scores, (b) results of univariable linear regression analyses among the indexes of 24-hour systolic blood pressure and nitrate metabolic pathway scores, adjusted by age, initial NIHSS and NLR. Red represents the positive correlation, while green represents the negative correlation. The depth of color represents the absolute value of the correlation coefficient. *represents the results with false discovery rates less than 0.05 calculated by the Benjamini-Hochberg method. DN: denitrification, nitrate => nitrogen. ANR: assimilatory nitrate reduction, nitrate => ammonia. DNR: dissimilatory nitrate reduction, nitrate => ammonia. CV: CV of 24-hour systolic blood pressure. Mean: mean value of 24-hour systolic blood pressure. SD: SD of 24-hour systolic blood pressure.
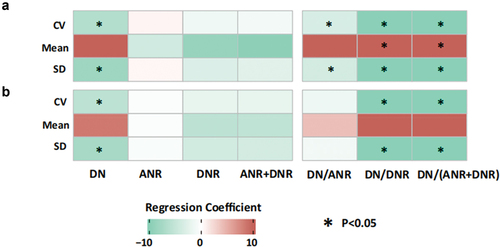
Figure 7. Function prediction score (KEGG score) and taxonomic prediction score (TAX score). (a) The tuning index (λ) was selected in the LASSO model and receiver operating characteristic curve generation was carried out, and its AUC was plotted against log (λ). Dotted vertical lines depict the optimal λ values employing the minimum deviation and 1 standard error of the minimum deviation (λ-SE). The λ of 0.094, with log (λ) of − 2.362 was chosen as the optimal value. (b) Coefficients were plotted versus log (λ). The vertical line is shown at the optimal value; optimal λ yielded five non-zero coefficients. (c) The function prediction score (KEGG score) was based on a linear combination of four KEGG IDs and one constant. (d) The tuning index (λ) was selected in the LASSO model and receiver operating characteristic curve generation was carried out, and its AUC was plotted against log (λ). Dotted vertical lines depict the optimal λ values employing the minimum deviation and 1 standard error of the minimum deviation (λ-SE). The λ of 0.126, with log (λ) of − 2.071 was chosen as the optimal value. (e) Coefficients were plotted versus log (λ). The vertical line is shown at the optimal value; optimal λ yielded five non-zero coefficients. (f) The taxonomic prediction score (TAX score) was based on a linear combination of four bacteria genera and one constant.
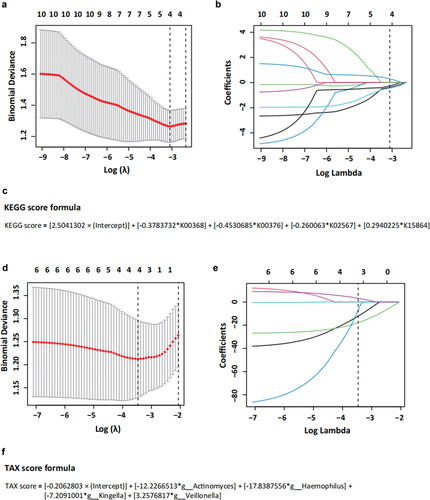
Table 4. Logistic regression analysis of bacteria, TAX score, KEGG score and 90-day functional prognosis in AIS patients with hypertension.
Figure 8. Mediation analyses testing SBP CV within the first 24 hours after hospitalizing as mediators between TAX score/KEGG score and 90-day mRS score.
Figure 9. Mediation analyses testing SBP CV within the first 24 hours after hospitalizing as mediators between TAX score and 90-day mRS score. Model adjusted for age and initial NIHSS.