Figures & data
Table 1. Career learning activities. Per cent
Table 2. Student rating of important factors (“rather important” and “very important”) for their choice of upper secondary education. The majority view and the occurrence of a contrasting views. Per cent
Table 3. Student rating of non-important factors (“not important at all” and “not of particular importance”) for their choice of upper secondary education. The majority view and the occurrence of a contrasting view. Per cent
Table 4. Students’ ratings of the importance of factors in relation to their future life (“rather important” or “very important”). Per cent
Table 5. Students’ ratings of the importance of factors in relation to their future life (“Rather important” or “Very important”). Low-selected factors 2017 total, and distributed on sex and family background. Student ratings 1992 and 2005 total, and distributed on sex. Per cent
Table 6. Students’ ratings of the importance of factors in relation to their future life (“Rather important” or “Very important”). Medium-selected factors 2017 total, and distributed on sex and family background. Student ratings 1992 and 2005 total, and distributed on sex. Per cent
Table 7. Students’ ratings of the importance of factors in relation to their future life (“Rather important” or “Very important”). High-selected factors 2017 total, and distributed on sex and family background. Student ratings 1992 and 2005 total, and distributed on sex Per cent
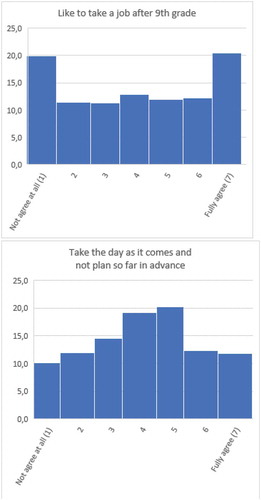
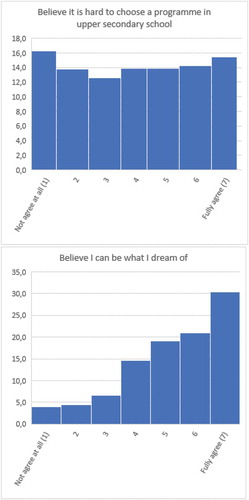
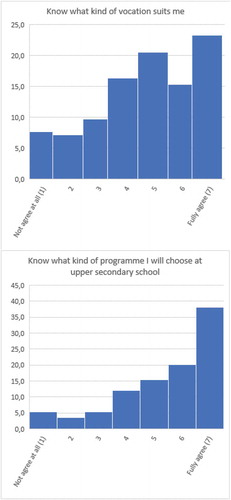
Table 8. Students’ view of themselves, school, and career choices. Student ratings 2005 and 2017. Percentage of students agreeing with the statements
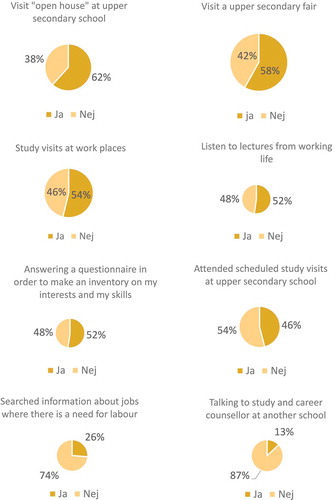
Figure 1. Students’ career learning activities in order to prepare for choosing education and vocation in the future. Percent. (Ja=Yes; Nej=No)
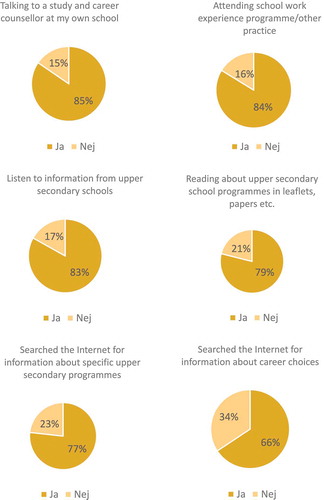
Figure 1. (cont.) Students’ career learning activities in order to prepare for choosing education and vocation in the future. Percent. (Ja=Yes; Nej=No)