Figures & data
Table 1. The steps of the geographic inquiry process and the items related to these steps.
Table 2. Distribution of the study group by gender, class, type of school placement, school region, and type of school.
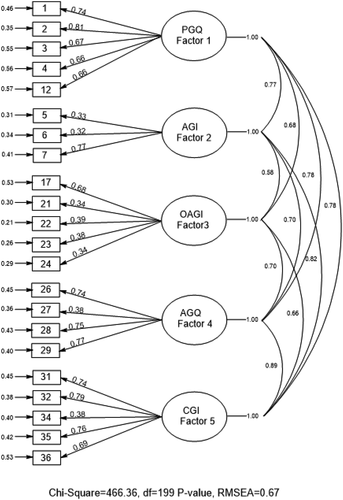
Table 3. Factor load values, common factor variance, and the variances explained by the factors*.
Table 4. Goodness of fit indices, reference ranges, and goodness of fit indices of the model.
Table 5. The correlation coefficients between the sub factors.
Table 6. Reliability coefficients.
Table 7. Means and standard deviations of the items, total correlations of the items, and cronbach alpha coefficient.
Table 8. The t values for the 27% lower and upper groups of the item analysis of the scale.

