
Figures & data
Figure 1. Graph of
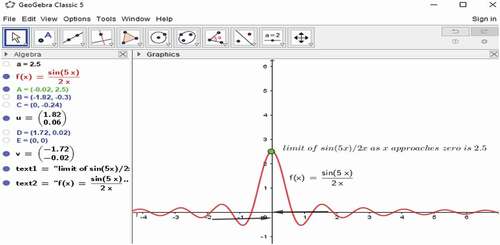
Figure 2. Graph of diving board function
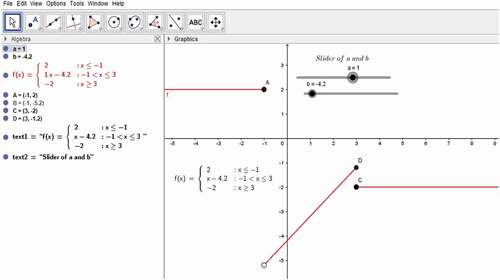
Figure 3. Values where the function is continuous
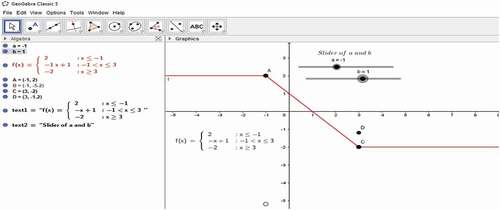
Table 1. Stages of the cycle model.
Figure 4. Participants’ demographic information.
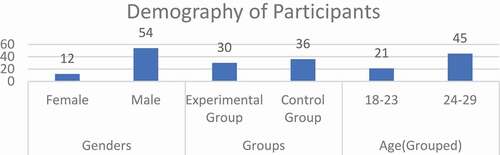
Table 2. Summary of item analysis of DCAT.
Table 3. Normality of pre-test.
Table 4. Overall descriptive statistics of the two groups’ proficiency in differential calculus before the intervention.
Table 5. Overall one-way analysis of variance summary table comparing groups’ achievement in differential calculus before intervention.
Table 6. Overall descriptive statistics for two groups on differential calculus achievement after the treatment.
Table 7. Descriptive analysis of student proficiency in conceptual and procedural understanding.
Table 8. Descriptive analysis of normality test of post-test data.
Table 9. Descriptive analysis of normality test of post-test proficiency data.
Table 10. Mann-Whitney U test on students’ scores in differential calculus.
Table 11. Interpretation of the effect sizes.
Data availability statement
The data and materials used in the current study are available from the corresponding author upon request.