
Figures & data
Table 1. Data collected from the 18 volunteers.
Table 2. Data of individuals with BMI < 25 kg/m2.
Table 3. Data of individuals with BMI ≥ 25 kg/m2.
Figure 1. The 18 plantar skin thermograms of the volunteers, arranged as they were taken.
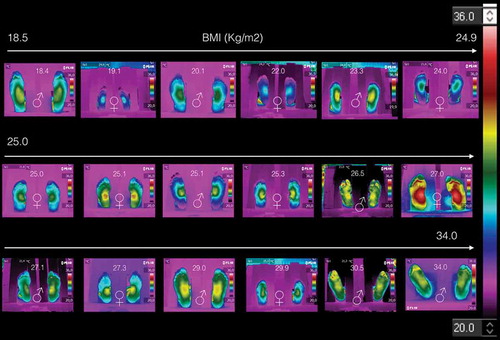
Table 4. Averaged temperatures on the medial longitudinal arc, angiosomes, and total averaged of the angiosomes for individuals with BMI < 25 kg/m2, for the right and left feet. LCA: lateral calcaneal artery, MCA: medial calcaneal artery, LPA: lateral plantar artery, MPA: medial plantar artery.
Table 5. Averaged temperatures on the medial longitudinal arc, angiosomes, and total averaged of the angiosomes for individuals with BMI ≥ 25 25 kg/m2, for the right and left feet.
Table 6. Data collected from the 40 diabetic volunteers.
Figure 2. Thermograms of volunteers with BMI < 25 kg/m2. Three main characteristics are shown: (1) symmetry, i.e., the temperature distribution on the right feet is almost the mirror image of those of the left feet. (2) The medial longitudinal arch is the hotter part of the plantar skin for both women and men. (3) The temperature decreases distally from the medial longitudinal arch to the periphery.
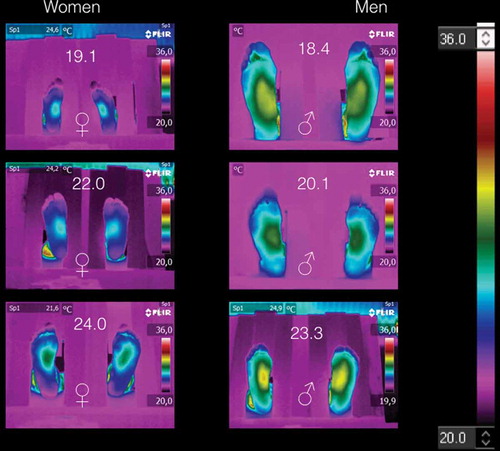
Figure 3. Thermograms of volunteers with BMI ≥ 25 kg/m2. It is not possible to distinguish women thermograms from those of men thermograms. However, symmetry is observed in some of these thermograms. The temperature distribution is still decreasing from the middle to the periphery of the foot.
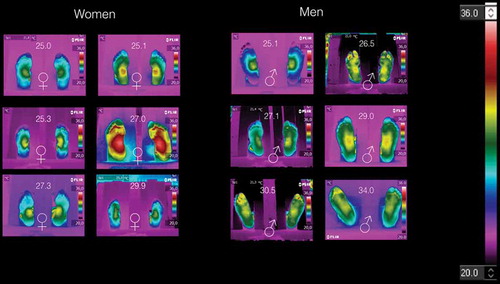
Figure 4. Thermograms of nine diabetic patients. The symbols ♀ and ♂ represent woman or man, respectively. The number at the top is the BMI (given in kg/m2). The HbA1c is shown at the left-bottom, while the time with diagnostic of diabetic is given at right-bottom (years). The columns (a), (b), and (c) represent how temperature distribution is presented in the diabetic patients.
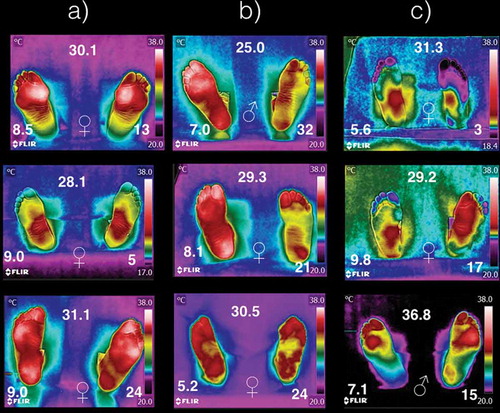
Figure 5. Six thermograms of the plantar skin. The three on the top corresponds to the individuals with BMI ≥ 25 kg/m2, while the three at the bottom are from the database of diabetic volunteers [Citation12]. The symbols ♀ and ♂ represent woman and man, respectively. The BMI of the individual is given at the central-top of each of the thermograms (given in kg/m2), and the HbA1c is given at the left-bottom for those thermograms of the diabetic patients.
![Figure 5. Six thermograms of the plantar skin. The three on the top corresponds to the individuals with BMI ≥ 25 kg/m2, while the three at the bottom are from the database of diabetic volunteers [Citation12]. The symbols ♀ and ♂ represent woman and man, respectively. The BMI of the individual is given at the central-top of each of the thermograms (given in kg/m2), and the HbA1c is given at the left-bottom for those thermograms of the diabetic patients.](/cms/asset/b6dde264-b3b2-4e65-9c1c-30e08d393085/zdfa_a_1361298_f0005_oc.jpg)