Figures & data
Table 1. Data collected from 186 diabetic patients.
Figure 1. Four thermograms taken in four different dates. At the top of each thermogram is the date of acquisition, and the average temperature is written above each foot. The thermograms numbered 695 and 943 correspond to a female, 59 years old, BMI of 28 kg/m2, 14 years with diagnosis of diabetes mellitus. The thermograms numbered 1295 and 1889 are from a male patient, 73 years old, BMI of 23.6 kg/m2, 23 years with diagnosis of diabetes mellitus.
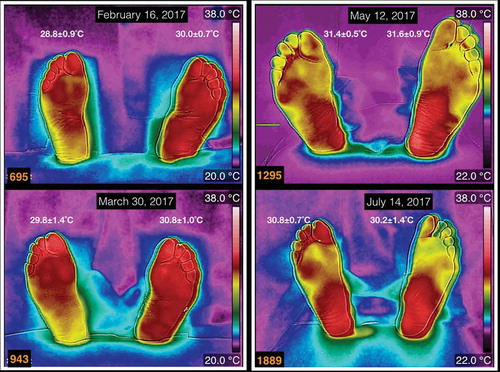
Figure 2. Three thermograms of the plantar skin of a diabetic patient, with the left Charcot foot. The date of the acquisition of the thermogram is at the the top of each thermogram. The average temperatures are written above each foot. This patient is a male, 62 years old, 27 years with diagnosis of diabetes mellitus.
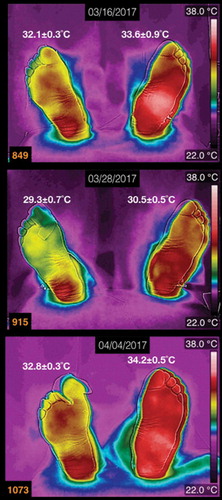
Figure 3. A thermogram of a diabetic female patient, who has a history of recurrent ulcers on her left foot. The average temperatures are written above each foot. The patient is 62 years old, BMI of 25.4 kg/m2, 15 years with diabetes diagnosis.
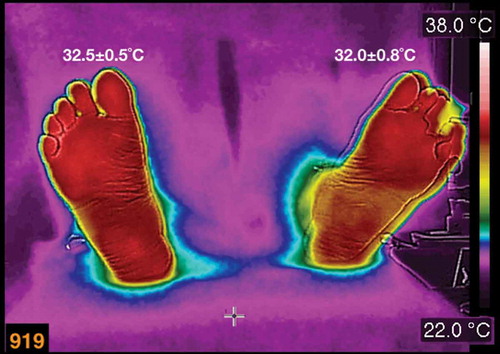
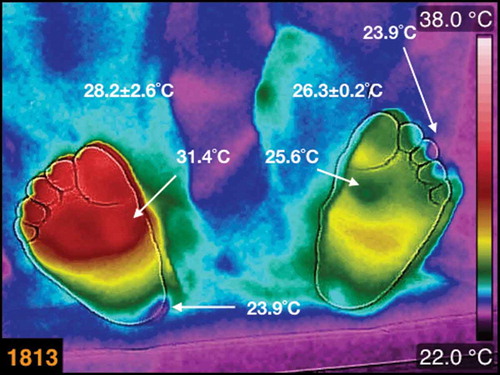
Figure 4. (a) Thermogram from a diabetic patient (the average temperatures are written above each foot). The patient is a female, 48 years old, BMI 38.7 kg/m2, 12 years with diagnosis of diabetes mellitus. (b) The arrows show the temperatures on the hot spot and some samples of the temperatures surrounding the hot spot.
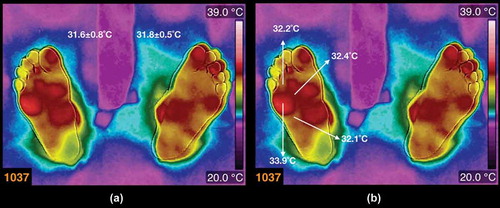
Figure 5. The thermogram of the plantar skin of a female, diabetic patient, 60 years old, BMI 24.7 kg/m2, 8 years with diagnosis of diabetes mellitus. The average temperatures are written above each foot. The small cold regions on the third toe of the left foot, and on the medial-posterior part of the heel of the right foot, are identified by arrows.