Figures & data
Table 1. Patient characteristics.
Figure 1. Flow diagram of patients’ participation in the study. Boxes on the left show the number of patients completing the study-specific questionnaire (SSQ) at each time point. Boxes in the middle show the number of patients participating in the study. Boxes on the right show the number of patients excluded and drop-outs.
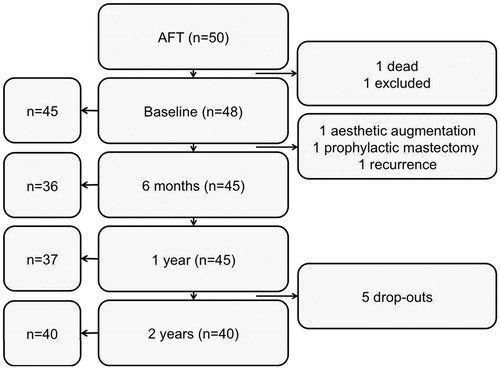
Figure 2. Mean line plots for Q1–Q4 and Q9–Q20. The mean line plots for each item at each time point are shown for all patients who completed the SSQ.
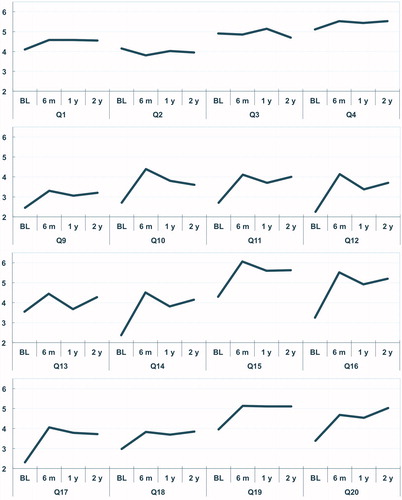
Table 2. Results for Q1–Q4 and Q9–Q20 on sensitivity, pain, appearance, softness, trouble finding a good-fitting bra and willingness to participate in physical activities.
Table 3. Q1–Q4 and Q9–Q20.
Figure 3. Q5–Q8 focusing on sexuality and willingness to be naked. The graphs show the percentage of answers in each category, for each item, at baseline and after 2 years. The ordinal trend is the chance of scoring one category more positive than one category more negative at follow-up. Significant items are given in boldface. CI: confidence interval.
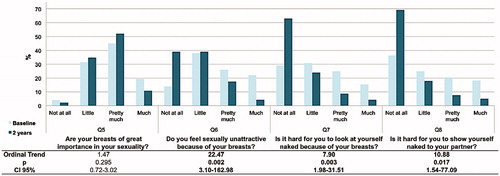
Figure 4. Results for the eight domains of SF-36 of the study population and the age matched reference population of Swedish women (n = 3260). PF: physical functioning; RP: physical role functioning; BP: bodily pain; GH: general health; VT: vitality; SF: social role functioning; RE: emotional role functioning; MH: mental health.
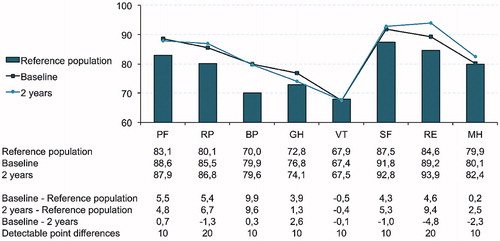
Figure 5. A 31-year-old women that presented with a scar retraction and volume deficiency 3.6 years after breast conserving surgery and radiotherapy (left). She underwent three AFT procedures with totally 150 ml fat. 2.2 years post-operative the scar is not visible and the symmetry is better (right).
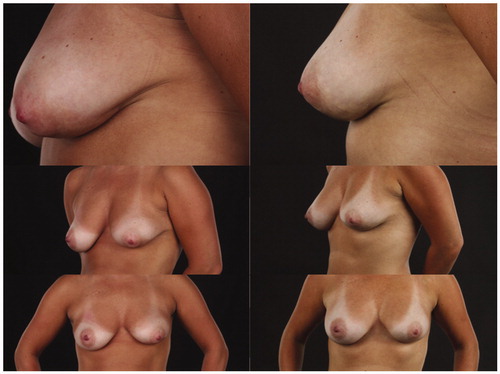
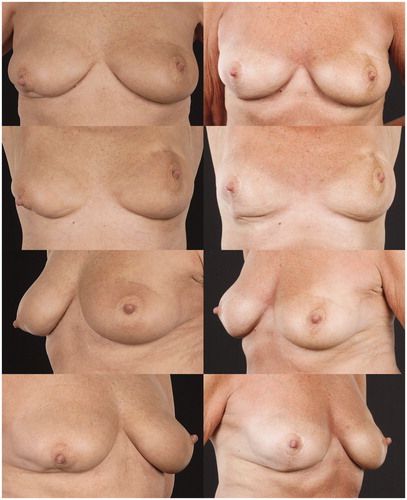
Figure 6. A 66-year-old woman with bilateral defects after BCS and RT (left). Time from RT to AFT was 2.6 years for the left breast and 1 year for the right breast. She underwent two AFT procedures to each breast with totally 69 ml to the left side and 100 ml to the right. In addition, she underwent mastopexy on the right side. Post-operative images from the 2-year follow-up are shown to the right.