Figures & data
Table 1. Age (years) at the time of biopsy of all patients and patients with arm and leg lymphedema.
Figure 1. Representative hematoxylin and eosin staining of biopsies from (A) control and (B) patient; cancer-induced lymphedema in left leg. Biopsies from (C) control and (D) patient; cancer-induced lymphedema in right arm.
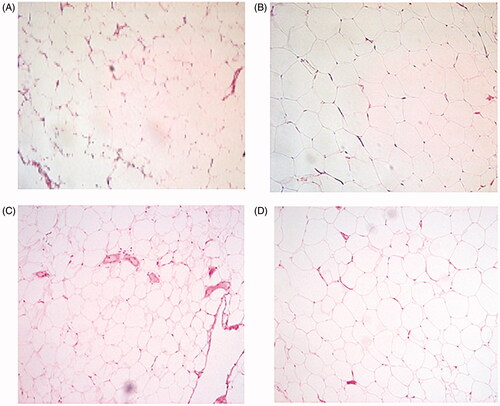
Figure 2. Mean adipocyte size (mean ± SEM) between lymphedema and control in all patients.
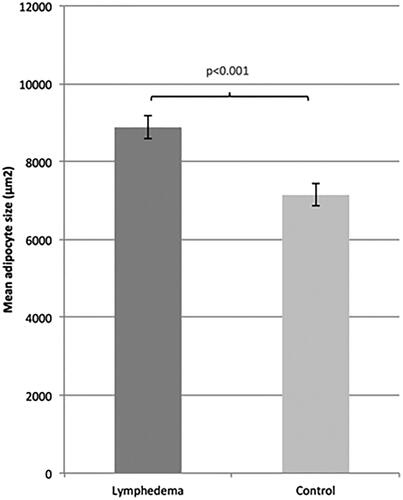
Figure 3. Mean adipocyte size difference (mean ± SEM) between arms and legs.
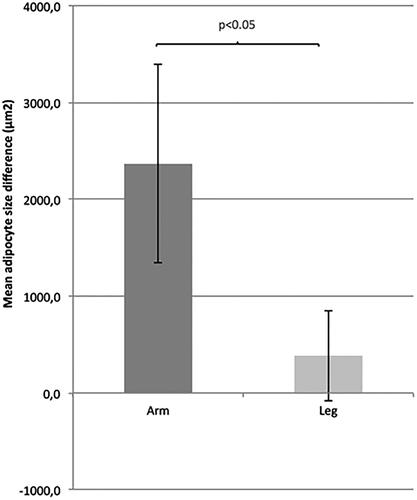
Table 2. Duration and onset (time from cancer operation to debut of lymphedema) of lymphedema, previous radiotherapy and chemotherapy in patients with larger adipocytes in lymphedema than in controls, and patients with smaller adipocytes in lymphedema than in controls (all leg lymphedema).
Figure 4. Mean adipocyte size difference (mean ± SEM) between control and lymphedema in arm and leg, respectively.
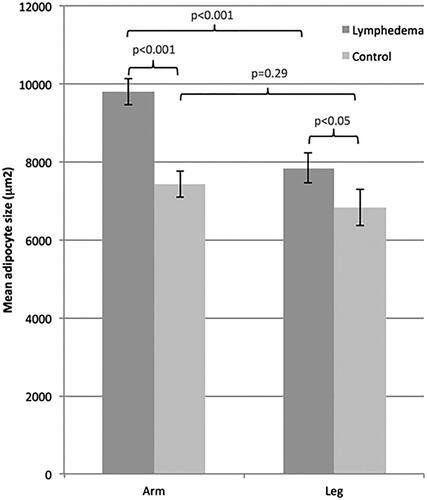
Figure 5. Mean adipocyte size difference (mean ± SEM) between patients who had and who had not received previous radiotherapy.
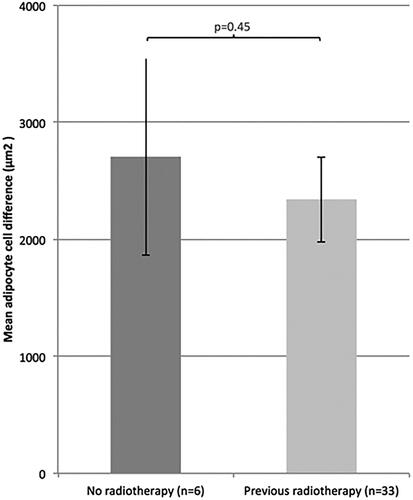
Figure 6. Mean adipocyte size difference (mean ± SEM) between patients who had and who had not received previous chemotherapy.
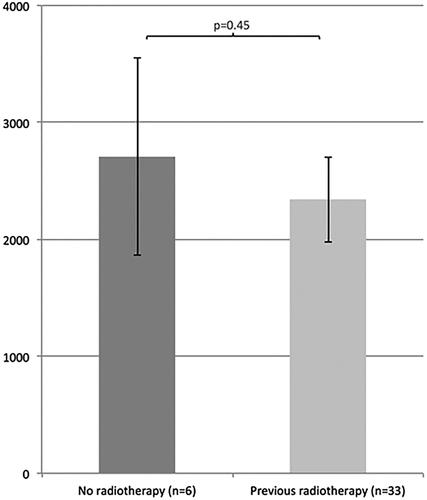
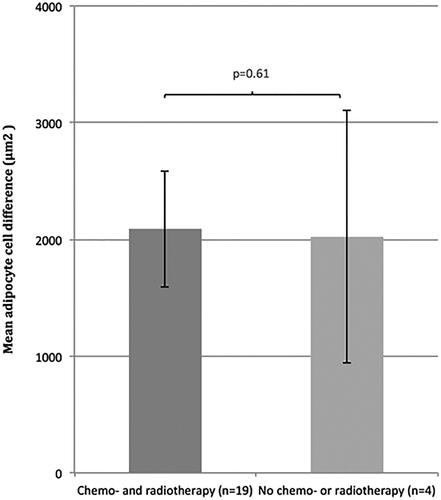
Figure 7. Mean adipocyte size difference (mean ± SEM) between patients who had received both chemo- and radiotherapy, and patients who had not received any additional treatment.