
Figures & data
Figure 1. The course of the study. Figure created by Åsa Bell, medical photographer, Department of Plastic and Reconstructive surgery, Sahlgrenska University Hospital, Gothenburg, Sweden.
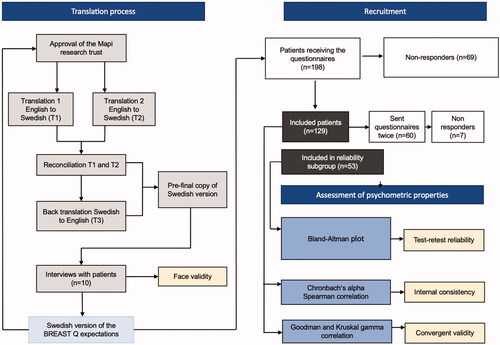
Table 1. Demographics.
Table 2. Missing data.
Table 3. Cronbach’s α.
Table 4. The inter-item correlations of the Support domain.
Table 5. The inter-item correlations of the Pain domain.
Table 6. The inter-item correlations of the Coping domain.
Table 7. The inter-item correlations of the Appearance domain.
Figure 2. Bland–Altman plot for pain. Dotted lines are mean score 1 and score 2 (−0.4) and Limits of agreement (−52 and 51). Calculations are based on Rasch converted scores (1–100).
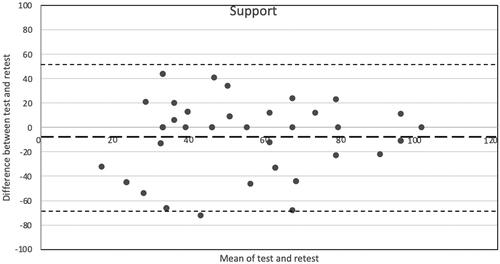
Figure 3. Bland–Altman plot for appearance. Dotted lines are mean score 1 and score 2 (−1.6) and Limits of agreement (−51 and 48). Calculations are based on Rasch converted scores (1–100).
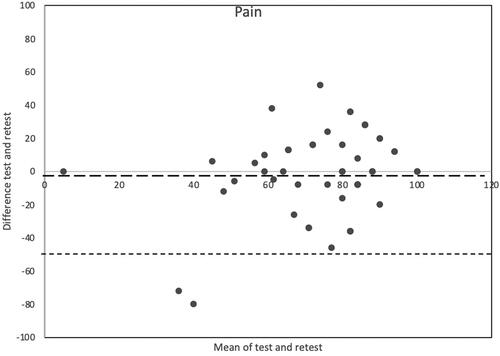
Figure 4. Bland–Altman plot for support. Dotted lines are mean difference between score 1 and score 2 (−6.8) and limits of agreement (−53 and 67). Calculations are based on Rasch converted scores (1–100).
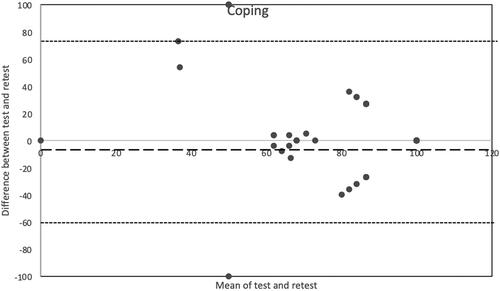
Figure 5. Bland–Altman plot for coping. Dotted lines are Mean score 1 and score 2 (7.7) and Limits of agreement (−60 and 75). Calculations are based on Rasch converted scores (1–100).
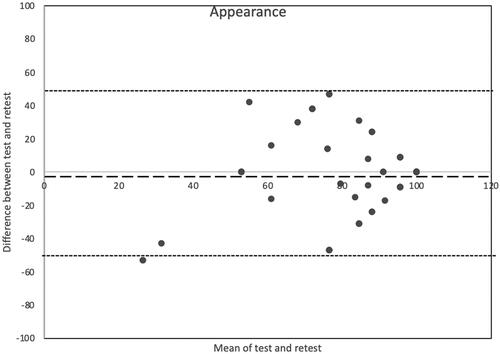
Table 9. Floor and ceiling effects.
Table 8. Correlation between Breast-Q (0-100) and VAS.
Data availability statement
The datasets generated and analysed during the current study are not publicly available due to patient confidentiality, but are available from the corresponding author on reasonable request and permissions.