
Figures & data
Figure 1. Search strategy. From Moher D, Liberati A, Tetzlaff J, Altman DG. The PRISMA group. Preferred Reporting Items for Systematic Reviews and Meta-analyses: the PRISMA statement. PLoS Med. 2009;6:e1000097. For more information, visit www.prisma-statement.org.
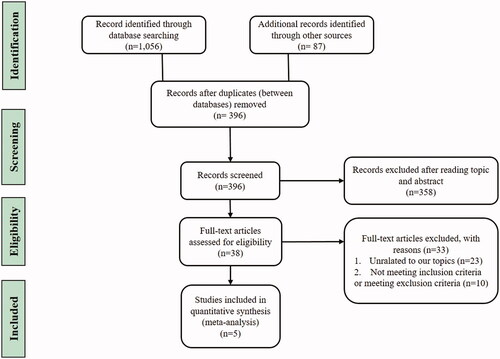
Table 1. Inclusion and exclusion criteria.
Table 2. Treatment characteristics, outcome measures and corresponding results, including complications.
Table 3. The revised and validated version of MINORS [Citation16].
Figure 2. The forest plot of included studies. It can be seen that the large intra-study variance is the paper published in 1992 by DD McGeorge and Stilwell and the paper published in 2000 by al-Qattan et al., and the large inter-study variance is the paper published in 1992 by McGeorge and Stilwell and the paper published in 1977 by Wray et al.
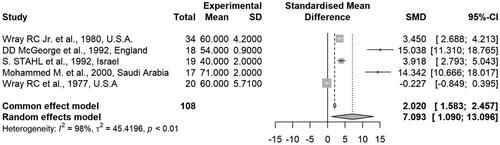
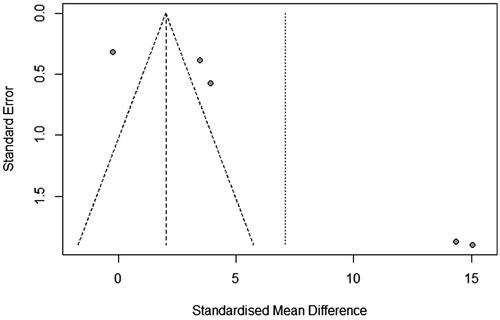
Figure 3. The funnel plot. In general, small-scale studies are distributed widely at the bottom, and large-scale studies are distributed narrowly at the top of the funnel. In this plot, there are one distribution to the left and four distributions to the right outside the funnel.
Data availability statement
https://www.crd.york.ac.uk/prospero/display_record.php?ID=CRD42022316096