
Figures & data
Table 1. General characteristics of the study cohort (N = 455).
Figure 1. Linkage disequilibrium (LD) map. Linkage disequilibrium for the 8 ADIPOQ polymorphisms investigated. D’ values are depicted in the diamonds, with darker colours depicting stronger LD. The LD map was created using the confidence interval of LD, implemented in Haploview version 4.2.
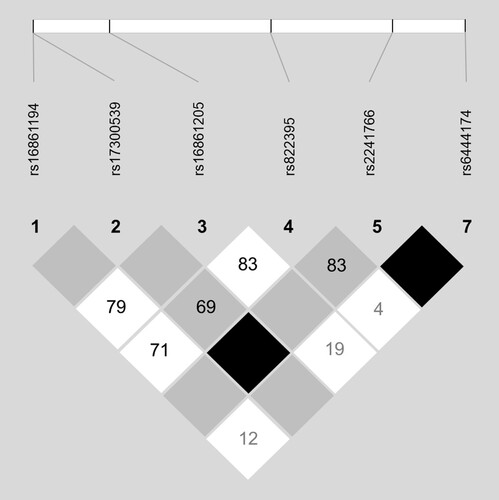
Table 2. Characteristics of the eight SNPs genotyped in 455 participants.
Table 3. Genotype distribution of the selected ADIPOQ SNPs with PTSS severity at baseline, 3 and 6 months.
Table 4. Linear mixed model of ADIPOQ SNPs and posttraumatic stress symptom (PTSS) severity at 3- and 6-month follow up.
Supplemental Material
Download MS Word (226 KB)Data availability statement
The data that support the findings of this study are being used to address additional study aims and cannot be shared publicly at this stage. The study collaborative team will review individual requests to access data.