
Figures & data
Table 1. Sample characteristics.
Table 2. Means (SDs) of the PCL-5 Scores for type I and type II trauma survivors.
Figure 1. Means of individual PCL items (with standard errors; Panel A) and estimated symptom networks for type-1 (Panel B) and type-2 (Panel C) trauma survivors.
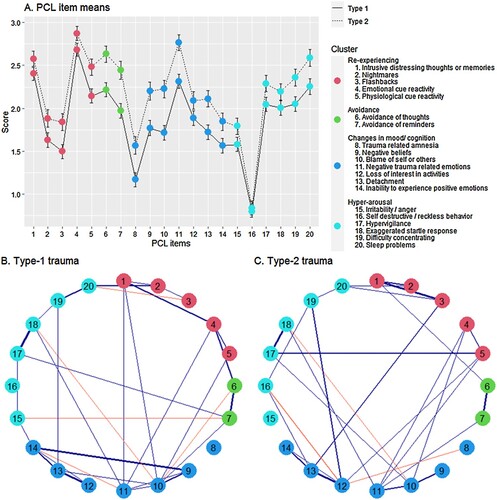
Figure 2. Bayes factors (BFs) for edge-wise group differences.
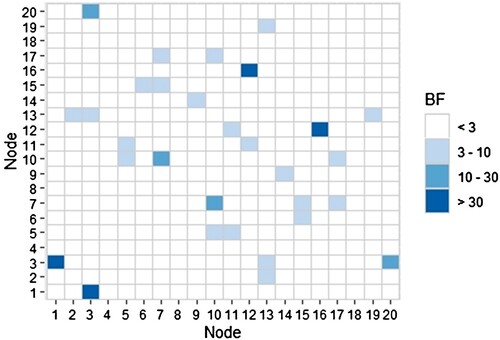
Table 3. Bayes Factors (BFs) and Posterior Means and Standard Deviations for Edge-wise Group Differences (BF>3).
Supplemental Material
Download MS Word (151.1 KB)Data availability statement
Data can be shared with other researchers on request. Unfortunately, we did not obtain informed consent from the participants in this study to make their data publicly available. As our local Ethics Committee deems this necessary when making data publicly available, we are unable to post the data in an open repository.