
Figures & data
Table 1. Sample characteristics (n = 73).
Figure 1. Levels of posttraumatic stress symptoms (PTSS) in youth with CPTSD compared to youth with PTSD over the course of TF-CBT, measured pre-treatment, session 5, session 10, session 15 and post-treatment.
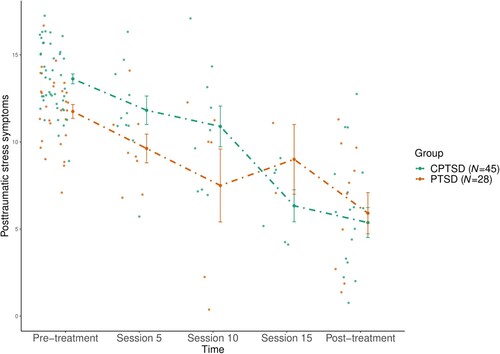
Table 2. Associations between CPTSD (vs PTSD) and change in symptoms of posttraumatic stress and complex posttraumatic stress from pre-treatment to post-treatment (T1–T5) in the intent to treat sample (n = 73)Table Footnotea.
Figure 2. Levels of complex posttraumatic stress symptoms (CPTSS) in youth with CPTSD compared to youth with PTSD over the course of TF-CBT, measured pre-treatment, session 5, session 10, session 15 and post-treatment.
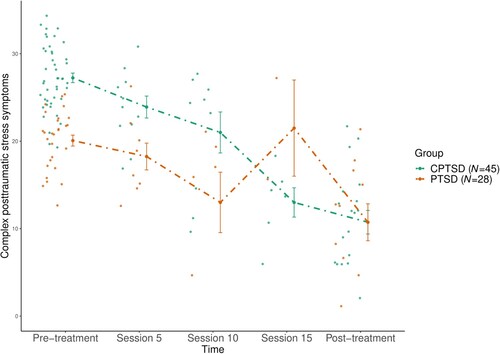
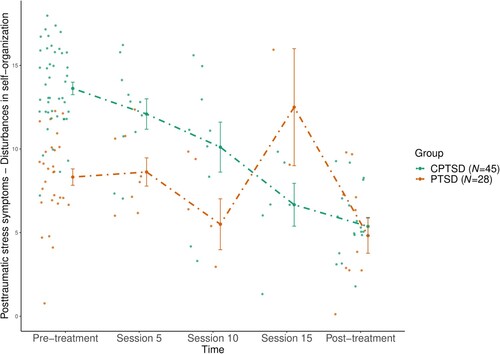
Figure 3. Levels of disturbances in self-organization (DSO) in youth with CPTSD compared to youth with PTSD over the course of TF-CBT, measured pre-treatment, session 5, session 10, session 15 and post-treatment.
Supplemental Material
Download MS Word (30.2 KB)Data availability statement
According to European law (GDPR), data containing potentially identifying or sensitive patient information are restricted. Our data involving clinical participants are therefore not freely available. Data may be made available upon reasonable request.