

Figures & data
Figure 1. (a–e) Undirected networks of PTSD and depression symptoms at T1 (a; N = 340), at T2 (b; N = 311), at T3 (c; N = 290), T4 (d; N = 288), and T1–T4 longitudinal slopes network (e; N = 254).
Notes: C1 = Feel bothered. C2 = Poor appetite. C3 = Feel blue. C4 = Lack feeling good. C5 = Trouble keeping my mind. C6 = Depressed mood. C7 = Effortful. C8 = Hopelessness. C9 = Feel failure. C10 = Fearful. C11 = Restless sleep. C12 = Lack happiness. C13 = Talk less. C14 = Lonely. C15 = Find people unfriendly. C16 = Lack enjoyment. C17 = Crying. C18 = Sadness. C19 = Feel disliked. C20 = Cannot get going. P1 = Intrusive thought. P2 = Nightmare. P3 = Flashback. P4 = Emotional cue. P5 = Physiological cue. P6 = Avoid thought. P7 = Upset. P8 = Avoid reminder. P9 = Loss of interest. P10 = Detachment. P11 = Restricted affect. P12 = Foreshortened future. P13 = Sleep disturbance. P14 = Irritability/anger. P15 = Difficulty concentrating. P16 = Hypervigilance. P17 = Exaggerated startle. Blue edges indicate positive associations between nodes, while red edges indicate negative associations. Thickness of edges indicate their strength. Light-blue nodes are bridge nodes identified via the bridge expected influence (BEI) scores. Orange nodes are individual items of CES-D not identified as bridge nodes. Green nodes are individual items of PDS-C not identified as bridge nodes.
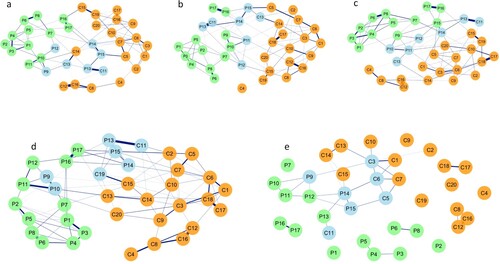
Figure 2. Symptom centrality plots based on the strength centrality index of cross-sectional undirected networks (T1, T2, T3, T4) and longitudinal change trajectory slope network.
Notes: (R) = reverse scored and worded. Bother = Feel bothered. PAppetite = Poor appetite. Blue = Feel blue. Good (R) = Lack feeling good. Mindless = Trouble keeping my mind. Depressed = Depressed mood. Effort = Effortful. Hope (R) = Hopelessness. Failure = Feel failure. Fear = Fearful. RestSleep = Restless sleep. Happy (R) = Lack happiness. TalkLess = Talk less. Lonely = Lonely. Unfriendly = Find people unfriendly. Enjoy (R) = Lack enjoyment. Cry = Crying. Sad = Sadness. Disliked = Feel disliked. NotGetGo = Cannot get going. ThIntrusive = Intrusive thought. Nightmare = Nightmare. Flashback = Flashback. EmoReact = Emotional cue. PhyReact = Physiological cue. ThAvoid = Avoid thought. Upset = Upset. RemAvoid = Avoid reminder. LInterest = Loss of interest. Detach = Detachment. RestrictA = Restricted affect. FortFuture = Foreshortened future. DisSleep = Sleep disturbance. Irritate = Irritability/anger. DiffConcen = Difficulty concentrating. HVigilant = Hypervigilance. Startle = Exaggerated startle.
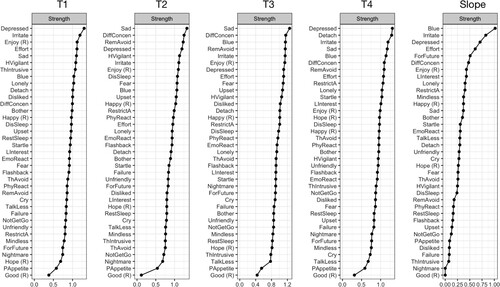
Figure 3. Symptom bridge centrality plots based on the bridge expected influence (BEI) index of cross-sectional undirected networks (T1, T2, T3, T4) and longitudinal change trajectory slope network.
Notes: (R) = reverse scored and worded. Bother = Feel bothered. PAppetite = Poor appetite. Blue = Feel blue. Good (R) = Lack feeling good. Mindless = Trouble keeping my mind. Depressed = Depressed mood. Effort = Effortful. Hope (R) = Hopelessness. Failure = Feel failure. Fear = Fearful. RestSleep = Restless sleep. Happy (R) = Lack happiness. TalkLess = Talk less. Lonely = Lonely. Unfriendly = Find people unfriendly. Enjoy (R) = Lack enjoyment. Cry = Crying. Sad = Sadness. Disliked = Feel disliked. NotGetGo = Cannot get going. ThIntrusive = Intrusive thought. Nightmare = Nightmare. Flashback = Flashback. EmoReact = Emotional cue. PhyReact = Physiological cue. ThAvoid = Avoid thought. Upset = Upset. RemAvoid = Avoid reminder. LInterest = Loss of interest. Detach = Detachment. RestrictA = Restricted affect. FortFuture = Foreshortened future. DisSleep = Sleep disturbance. Irritate = Irritability/anger. DiffConcen = Difficulty concentrating. HVigilant = Hypervigilance. Startle = Exaggerated startle.
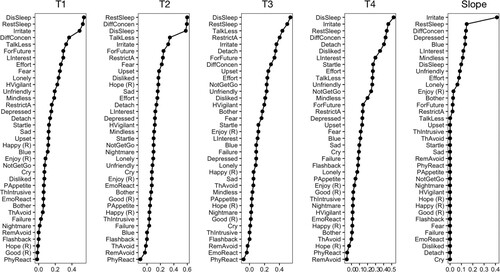
Table 1. Item description, identification number, and descriptive statistics of PDS-C and CES-D nodes at T1–4.
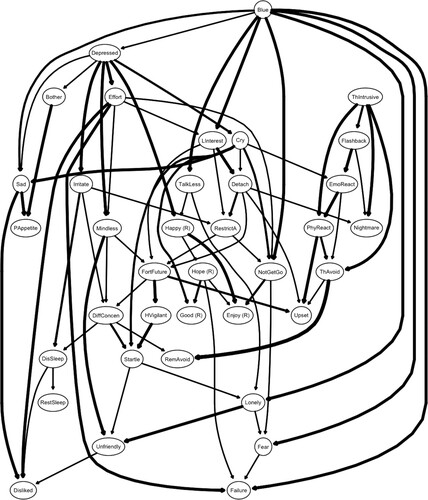
Figure 4. A directed acyclic graph (DAG) of PTSD and depression symptom change trajectories over time (N = 254).
Notes: (R) = reverse scored and worded. Bother = Feel bothered. PAppetite = Poor appetite. Blue = Feel blue. Good (R) = Lack feeling good. Mindless = Trouble keeping my mind. Depressed = Depressed mood. Effort = Effortful. Hope (R) = Hopelessness. Failure = Feel failure. Fear = Fearful. RestSleep = Restless sleep. Happy (R) = Lack happiness. TalkLess = Talk less. Lonely = Lonely. Unfriendly = Find people unfriendly. Enjoy (R) = Lack enjoyment. Cry = Crying. Sad = Sadness. Disliked = Feel disliked. NotGetGo = Cannot get going. ThIntrusive = Intrusive thought. Nightmare = Nightmare. Flashback = Flashback. EmoReact Emotional cue. PhyReact = Physiological cue. ThAvoid = Avoid thought. Upset = Upset. RemAvoid = Avoid reminder. LInterest = Loss of interest. Detach = Detachment. RestrictA = Restricted affect. FortFuture = Foreshortened future. DisSleep = Sleep disturbance. Irritate = Irritability/anger. DiffConcen = Difficulty concentrating. HVigilant = Hypervigilance. Startle = Exaggerated startle.
Supplemental Material
Download MS Word (4.6 MB)Data availability statement
Data used in the analyses are available through the following OSF link: https://osf.io/kbxtc.