
Figures & data
Figure 1. PCL score according to PDI and PDEQ score and loess regression for each time-measurement (not adjusted).
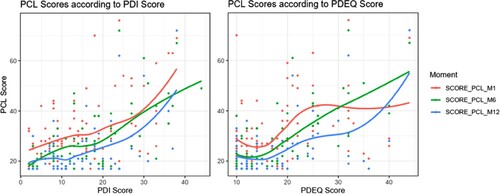
Table 1. Socio-demographic characteristics.
Table 2. Baseline clinical characteristics
Table 3. PCL score for an augmentation of 1 pt in the PDI Score (and by subscore) – mixed linear models.
Table 4. PCL score for an augmentation of 1 pt in the PDEQ Score (and by subscore) – mixed linear models.
Table 5. PTSD risk for an augmentation 1 pt in PDI Score (and by subscore) – mixed logisitc models.
Table 6. Association between baseline characteristics and baseline cortisol levels (bivariate)