
Figures & data
Figure 1. PRISMA Flowchart.
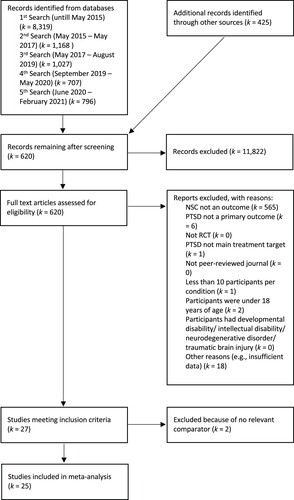
Table 1. Study characteristics coded.
Figure 2. Forest plot of between-group effect sizes (post-treatment). Notes. SMD refers to the comparison between the intervention and control groups at post-treatment; measure used is Hedges’ g; positive values refer to cases where the intervention group had a better averaged NSC value than the control group at post-treatment. NNT
= Number Needed to Treat (NNT with negative sign refers to Number Needed to Harm, NNH). CPT = Cognitive Processing Therapy. PE = Prolonged Exposure.
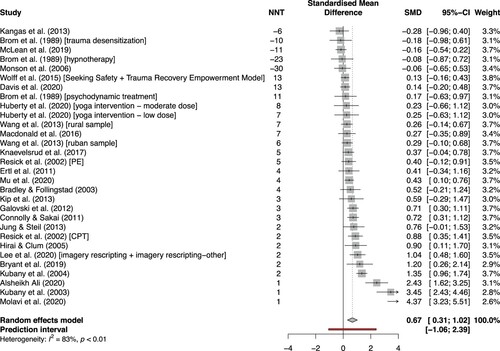
Table 2. Results of meta-analyses.
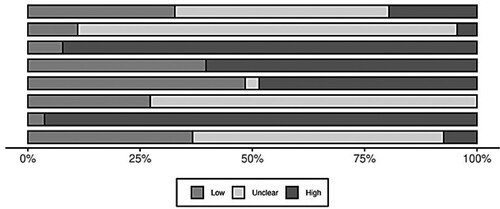
Figure 3. Weighted risk of bias of all studies (k = 25) assessed according to the Cochrane Risk of Bias Assessment Tool (Higgins et al., Citation2011).
Supplemental material