
Figures & data
Figure 1. Flow diagram for study participants.
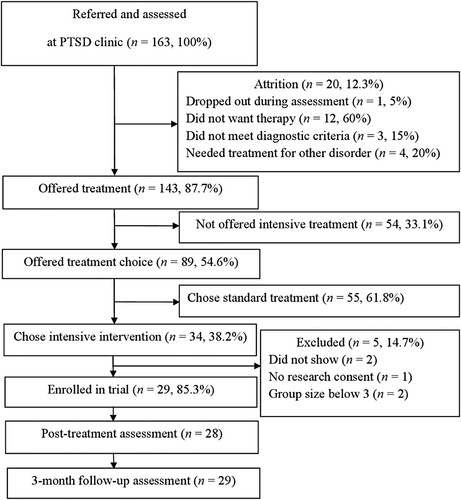
Table 1. Characteristics of the sample.
Table 2. Changes in symptoms and functioning from pre-treatment to three-month follow-up.
Figure 2. Changes in PTSD symptoms from pre-treatment to follow-up based on the PSS-I. Note: Error bars indicate 95% confidence intervals.
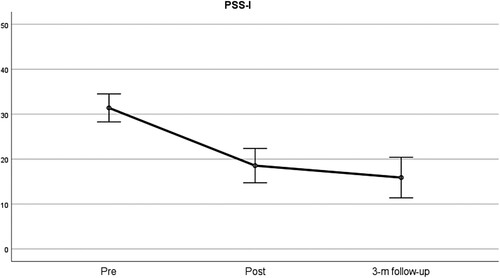
Figure 3. Changes in PTSD symptoms from pre-treatment to follow-up as measured with the PCL-5. Note: Error bars indicate 95% confidence intervals.
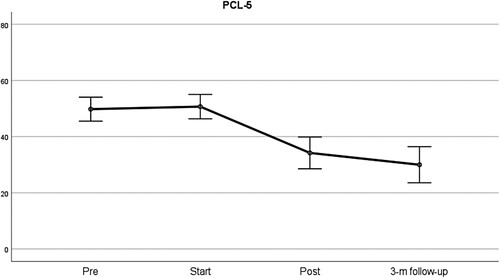
Table 3. Treatment response rates (from start of treatment to three-month follow-up) in percentages.
Table 4. Client satisfaction in percentages.
Data availability statement
Due to the nature of this research, participants of this study did not agree for their data to be shared publicly, so supporting data is not available.